Why depreciation matters and EBITDA doesn't
When it comes to weighing up asset-intensive sectors, depreciation matters. It is a real cost. This does not stop people ignoring it and touting the merits of companies based on their EBITDA.
Investors ignore the significance of depreciation at their peril and should be suspicious of companies that talk about EBITDA too much. To get an informed view on a company's performance and valuation, depreciation or some measure of stay-in-business capex needs to be taken into account.
Depreciation itself is not without its problems. It can give companies a convenient way to boost their profits by under-depreciating. Depreciation can also be too low - and profits too high - if companies under-invest and allow assets to become worn out (fully depreciated).
In this article I am going to show you how to analyse the assets of asset-intensive companies and check out whether their depreciation and profits are reliable numbers.
This analysis will be useful for anyone looking at the following sectors:
- Supermarkets
- Mining
- Asset rental companies
- Transport
- Manufacturers
- Telecoms
Pubs and bars are also a good example of an asset-intensive sector. Following the feedback on my recent stock watch article on Revolution Bars, I am going to look at three pub companies and show you why depreciation matters and why EBITDA does not.
This article is not for beginners but for those of you who want to try and understand this important subject it is well worth a read.
Phil Oakley's debut book - out now!
Phil shares his investment approach in his new book How to Pick Quality Shares. If you've enjoyed his weekly articles, newsletters and Step-by-Step Guide to Stock Analysis, this book is for you.
Share this article with your friends and colleagues:
Warren Buffett and Charlie Munger on Depreciation and EBITDA
This is what Warren Buffett had to say on the subject of depreciation and asset-intensive businesses in his 2015 letter to shareholders:
"Depreciation charges are a more complicated subject but are almost always true costs. Certainly they are at Berkshire. I wish we could keep our businesses competitive while spending less than our depreciation charge, but in 51 years I've yet to figure out how to do so. Indeed, the depreciation charge we record in our railroad business falls far short of the capital outlays needed to merely keep the railroad running properly, a mismatch that leads to GAAP earnings that are higher than true economic earnings. (This overstatement of earnings exists at all railroads.) When CEOs or investment bankers tout pre-depreciation figures such as EBITDA as a valuation guide, watch their noses lengthen while they speak."
He was even more damning when talking about the subject at the 2003 Berkshire Hathaway annual meeting:
"Not thinking of depreciation as an expense is crazy. I can think of a few businesses where one could ignore depreciation charges, but not many. Even with our gas pipelines, depreciation is real - you have to maintain them and eventually they become worthless (though this may be 100 years).
It [depreciation] is reverse float - you lay out money before you get cash. Any management that doesn't regards depreciation as an expense is living in a dream world, but they're encouraged to do so by bankers. Many times, this comes close to a flim flam game.
People want to send me books with EBITDA and I say fine, as long as you pay cap ex. There are very few businesses that can spend a lot less than depreciation and maintain the health of the business.
This is nonsense. It couldn't be worse. But a whole generation of investors have been taught this. It's not a non-cash expense - it's a cash expense but you spend it first. It's a delayed recording of a cash expense."
At the same meeting his business partner, Charlie Munger, gave a typically blunt assessment:
"I think that, every time you see the word EBITDA [earnings], you should substitute the word "bullshit" earnings."
I think Buffett and Munger are spot on in their comments.
What is depreciation?
Depreciation is an accounting measure which is used to match the cost of a fixed asset against the revenues it generates over its useful life.
There are different ways to calculate the annual depreciation of a fixed asset but the most common method is known as straight line depreciation. This is when the amount of depreciation is spread evenly over the useful life of the asset. Straight line depreciation is calculated as follows:
Straight line depreciation = (cost less residual value)/Useful life
I find one of the best ways to explain depreciation is to use the example of buying a new car. Most people understand that if they buy a new car it will lose value and will be worth a lot less in three, five or ten years' time.
Just a quick aside here. Cars do not depreciate evenly in a straight line. They tend to lose a significant chunk of value in the first year before the depreciation levels off. I am going to use straight line depreciation to highlight some of the tools of analysis you can use when analysing asset-intensive companies.
Let's take a look at the depreciation on buying a new Audi A3 car.
If you fancy buying a new, high spec Audi A3 Sportback it is going to cost £28,075 today (before discounts). If you drive it for three years and average 10,000 miles per year then internet car valuation guides say that the car is going to be worth £12,900 in three years' time. Note that many assets have limited or residual value because they are worn out at the end of the depreciation period.
We now have all the numbers needed to account for this car asset in the registers of a company's accounts:
- Cost £28,075
- Residual Value £12,900
- Useful life 3 years
If we are using straight line depreciation then the annual depreciation expense in the income statement and asset register will be:
Annual Depreciation = (£28,075-£12,900)/3 = £5,058.33
You can see my analysis below.
| Audi A3 2.0L 10k miles p.a. | Year 1 | Year 2 | Year 3 |
|---|---|---|---|
| Cost | 28,075 | 28,075 | 28,075 |
| Starting depreciation | 0 | 5,059 | 10,117 |
| Charge for the year | 5,059 | 5,058 | 5,058 |
| Accumulated depreciation | 5,059 | 10,117 | 15,175 |
| Net book value (NBV) | 23,016 | 17,958 | 12,900 |
| Depreciation rate | 18% | 18% | 18% |
| Asset age | 1.0 | 2.0 | 3.0 |
| NBV as % of cost | 82% | 64% | 46% |
| % written off | 18% | 36% | 54% |
To keep things simple I have used £5,059 in year 1 and £5,058 in years 2 and 3. As you can see, the asset is depreciated from an original cost of £28,075 to a value of £12,900 after three years.
You can see how depreciation works in an asset register. The main numbers to pay attention to are:
- The original cost of the asset.
- The annual depreciation charge.
- The accumulated depreciation over the life of the asset.
- The net book value (NBV) of the asset. This is the original cost less the accumulated depreciation. This number goes into the fixed or non-current asset number on the face of a company's balance sheet.
One of the most ignored numbers is the one for accumulated depreciation. At the end of three years, the car has accumulated depreciation of £15,175. What this number means in practical terms is that this is the minimum amount of money you would have to spend to replace your three year old Audi with a brand new one (on top of the trade-in value of the existing car).
The point I want to get across here is that depreciation is a real cost. It is an estimate of replacement cost which cannot be ignored unless of course the asset will last forever. This is why ignoring depreciation and basing investment decisions on profit numbers such as EBITDA is unwise in my opinion.
These numbers above also allow the analyst or investor to calculate some very useful ratios:
Depreciation rate = Annual depreciation charge/Original cost of asset
This tells us how quickly an asset is being depreciated. Short life assets should have higher depreciation rates than long life assets.
Asset age = Accumulated depreciation/Annual depreciation charge
An aging asset base can be a sign that a company is cutting back on investing which might have to be put right with a large capex plan in the future. Cutting back on investing is a good way for companies to boost their free cash flow. It would be a mistake for investors to value a company on this basis. They would be overstating the valuation because of the under-investment.
Cumulative depreciation ratio = NBV/Original Cost
As you can see in the table, after 3 years the car has been written down to 46% of its original cost.
Alternatively, you can calculate the percentage of the original cost that has been written off as a way of seeing how worn out a company's assets might be:
Worn out ratio = 1 - Cumulative depreciation ratio
At the end of three years, the value of the car has been written down by 54% of its original costs.
Analysing the depreciation of UK pub assets
Pubs are asset-intensive businesses yet the sector contains companies that bang on about EBITDA a lot. Are they trying to tell investors that depreciation doesn't matter?
The most important part of a pub's assets are its fixtures and fittings - the things you see inside a pub such as bars, flooring, lighting, tables, chairs, and toilets as well as things you don't see such as kitchen equipment. These assets wear out and need replacing regularly. This costs money - money that cannot be paid out to shareholders. Depreciation is therefore a real cost to pub companies.
Keeping a pub's fixtures and fittings well maintained is crucial. If they are not, the appearance of the pub quickly goes downhill and people go elsewhere for a drink or a meal. Investment is a key driver of like-for-like (LFL) sales in the pub sector. Companies often report a boost to LFL sales after pubs have been refurbished. Poorly invested pubs often see declining LFL sales.
Fixtures and fittings are therefore a major part of a company's capex and depreciation figures. If a company is under-investing or under-depreciating then its profits will be overstated.
This is more common than people realise. Fifteen years ago, when I was a City analyst, a colleague and I conducted a study of the depreciation of the main UK supermarkets and came to the conclusion that Tesco, Safeway and Sainsbury's were materially overstating their profits because the depreciation on their fixtures and fittings was too low. This was backed up by the fact that the companies continued to spend huge amounts of money on capex without materially improving their profitability.
Here I am going to look at the fixtures and fittings depreciation of three quoted UK pub/bar companies using the tools described above. The three companies are:
- Mitchells & Butlers (LSE:MAB)
- Revolution Bars (LSE:RBG)
- JD Wetherspoon (LSE:JDW)
I have chosen these companies as they are more or less pure pub companies without any brewing assets. In theory, they should have fairly similar fixtures and fittings assets which should aid comparisons.
I will look at each company in turn with a focus on the following:
- The depreciation rate.
- How worn out the company's assets are.
- The ratio of capex to depreciation.
- Any other signs or comments on whether the company is well invested (assets are in good condition) or not.
- EBITDA returns on gross tangible fixed assets.
Mitchells & Butlers
Mitchells & Butlers has recently been increasing the amount of money that it spends on its pubs. The information on its fixtures and fittings assets is taken from its annual reports and is shown below.
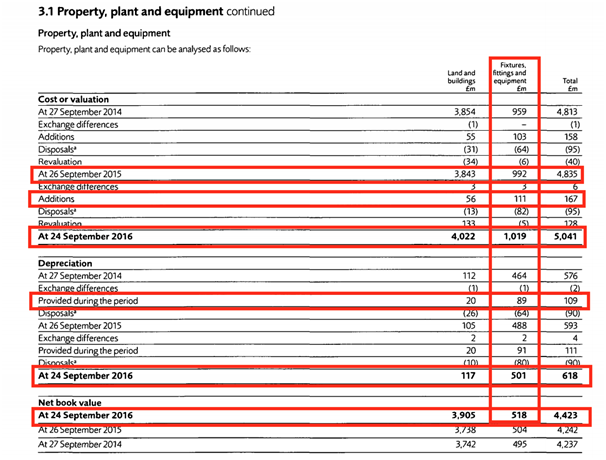
As you can see, the value of a company's assets changes for lots of reasons - additions, disposals, revaluations, impairments and exchange rates.
I have highlighted the numbers that you need to take into account to perform the depreciation analysis:
- Opening and closing value of assets at original cost which are £992m and £1,019m respectively.
- Additions (capex) of £111m.
- Depreciation for the year of £89m.
- Accumulated depreciation of £501m.
- Net book value of £518m.
| Mitchell & Butlers F&F | 2012 | 2013 | 2014 | 2015 | 2016 |
|---|---|---|---|---|---|
| Opening | 943 | 953 | 969 | 959 | 992 |
| Additions | 92 | 81 | 90 | 103 | 111 |
| Closing | 953 | 969 | 959 | 992 | 1,019 |
| Average cost | 948 | 961 | 964 | 976 | 1,006 |
| Depreciation | |||||
| Opening | 430 | 449 | 480 | 464 | 488 |
| Charge for the year | 88 | 87 | 90 | 89 | 91 |
| Closing | 449 | 480 | 464 | 488 | 501 |
| Net book value | 504 | 489 | 495 | 504 | 518 |
| Depreciation % of avg cost | 9.3% | 9.1% | 9.3% | 9.1% | 9.0% |
| Capex to depreciation | 105% | 93% | 100% | 116% | 122% |
| NBV as % of Gross BV | 53% | 50% | 52% | 51% | 51% |
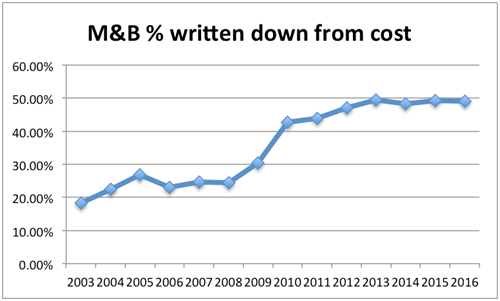
| % written down from cost | 47% | 50% | 48% | 49% | 49% |
| Estimated life | 10.8 | 11.0 | 10.7 | 11.0 | 11.0 |
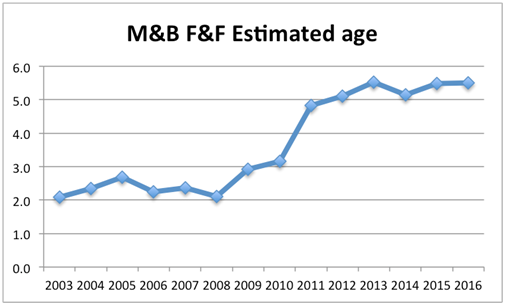
| Estimated age | 5.1 | 5.5 | 5.2 | 5.5 | 5.5 |
The table above shows how the depreciation ratios have been calculated. I have taken the analysis back to 2003 to get a long-term picture as to what has been going on with M&B's asset base.
Let's look at some of the key depreciation ratios.
Depreciation rate
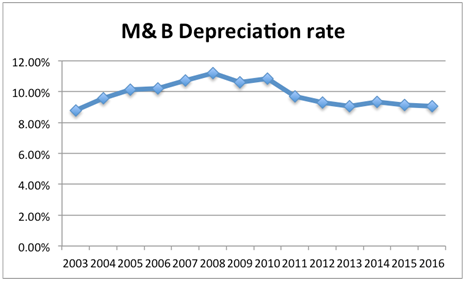
M&B's depreciation rate has been relatively steady. It was over 11% towards the end of the last decade but is now just over 9%. There are three main reasons for a depreciation rate to fall.
- Management extend the useful life of the asset. This is acceptable if the asset life was too low but extending asset lives can be a source of profit manipulation by lowering depreciation expenses.
- An increase in the amount of fully depreciated assets. This happens when the original cost of assets contains some that have been fully depreciated. They are in the denominator of the depreciation rate ratio but there is no depreciation for them in the numerator. This depresses the ratio. Fully depreciated assets will need to be replaced and so a falling depreciation ratio due to this can be a sign of a big capex bill on the way.
- Estimates of residual value are increased. When it comes to pub fixtures and fitting this is unlikely in my view.
My interpretation of M&B's declining depreciation rate is that it is a sign that its assets are in need of some attention.
Capex to Depreciation
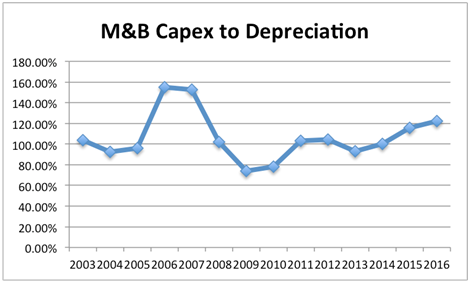
This is what seems to be happening. After a drop in investment during the last recession, investment is picking up. Management have been very open about this. They have told investors that the capex cycle of pubs is shortening. It used to work on an 11 year cycle and this is now coming down to 5 years.
"As I said earlier, getting onto a five year cycle is really key because we have currently been or recently been on an 11 year cycle. So just doing that in itself would make a material impact to our like-for-likes" M&B 2016 interim results
This is despite the fact that M&B's fixtures and fittings assets look reasonably well invested. They are only around 50% written off.
Its accounts state that its fixtures and fittings assets (F&F) are written off over 5-10 years. The estimated age of them is around 5 years.
Yet, M&B is increasing capex up to £200m per year on its pubs because it feels it needs to. It has realised that it cannot starve its pubs of investment and stay competitive. Running the business for cash is not an option as LFL sales fall sharply. CEO Phil Urban explained this with some very candid comments at M&B's 2016 interim results conference call:
"...that would be one reason why the run for cash option over the long run doesn't seem viable. I think if you are running brands you have got to polarise the estate and you have half of it doing very well because it is invested and the other half going backwards, you have to fix it. And I think the market is so competitive, particularly in the restaurant space that if you don't have quality amenity, you are not going to win. And even with great management teams and all those good things, there is too much choice so you have to fix that amenity. Then you can shout about your brand and then the brand adds some value, so that is pretty much the logic."
Generally speaking, the pub market is so competitive, with so much choice, that unless you keep pubs and bars in great condition you will lose custom. This is a very firm acknowledgement from a credible industry source that depreciation is a real cost and cannot be ignored. The finance director also confirmed that the level of capex spending would remain high:
"On capex, yes up to £200 million and probably staying at that level to maintain the 5 to 6 year cycle Phil [Urban] talked about."
At the time of its final results in November 2016, M&B's finance director confirmed to analyst Jamie Rollo from Morgan Stanley that depreciation would be increasing over the next few years due to the higher capex and shorter pub refurbishment cycle.
"Depreciation will increase over the new few years Jamie, as we increase the level of capex so I would expect in the current year to be £3-4 million higher than it was last year. Then as we build up to £200 million spend this year it will sort of lag the increase in the capex if you see what I mean. So there will be low single digits escalation in the depreciation charge we put through."
Perhaps M&B's capex and depreciation issues are something to do with its high exposure to pub restaurants. But what implications do its comments have for high street bar operators Revolution Bars and JD Wetherspoon?
Revolution Bars
Let's look at the trends in its depreciation ratios.
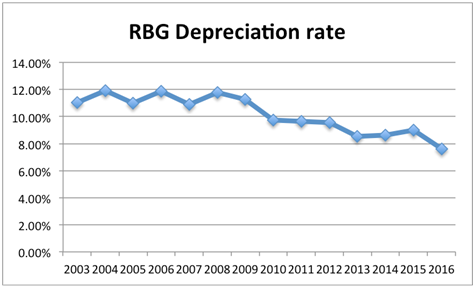
RBG's depreciation rate was running at a slightly higher rate to M&B's during the last decade. This indicates that its depreciation was relatively prudent. During the last five years the depreciation rate has started to decline and in 2016 it fell significantly to 7.63%.
This raises a number of questions.
Has RBG extended the useful life of its fixtures and fitting assets? This doesn't seem to be the case as its accounts state that useful lives are 5-10 years.
Does RBG have an increase in the amount of fully depreciated assets? This is possible as not all its bars have had the same amount of money spent on maintaining their assets. In 2013 and 2014 two thirds of its bar estate (around 39 bars) received spending of around £200,000 per bar. Around 19 bars did not receive any significant money spent on them.
RBG is very upfront about the fact that a large chunk of its profits come from key sites. At the time of its flotation it said that 86% of its EBITDA came from 25 sites. This implied that not much profit came from the other 32 sites.
It makes sense that the company protects the profits and trading performance from these key sites by spending money on them. In fact, the company reported an uplift in LFL sales in 2014 and 2015 showing the impact that investment in them can have.
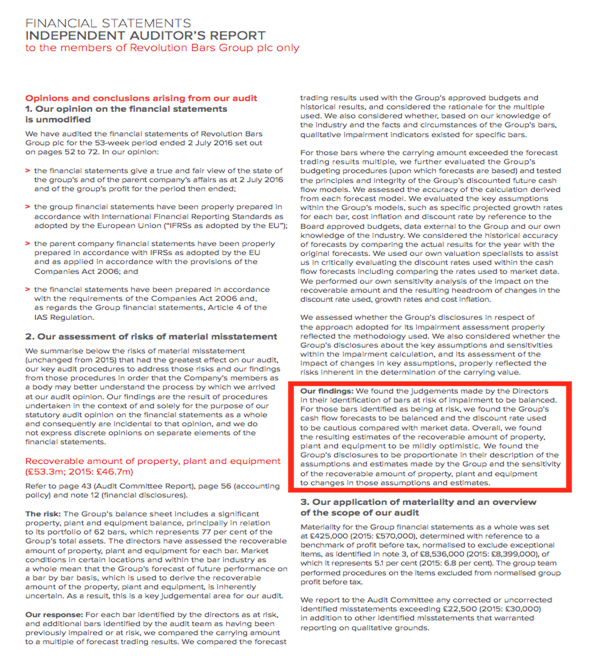
But could there be an issue with the non-key sites with fully-depreciated assets. I think the answer to this question is yes and RBG's auditors have raised this issue in its 2016 audit report on page 50 of the accounts.
The auditors looked at the estimated recoverable amounts of fixtures and fittings assets at so-called "at risk bars" and deemed their values to be "mildly optimistic". In other words they were under-depreciated and that the profits on these bars could be overstated. That said, any overstatement at the moment is unlikely to be significant or the auditors would not have signed off the accounts.
Another possible explanation for some of the decreased depreciation rate in 2016 could be that RBG opened 5 bars during the year. The total value of assets is on the balance sheet but only a part-year's depreciation is applied to them.
Capex has been increasing in recent years due to the 2013/14 refurbishment and the opening of new bars.
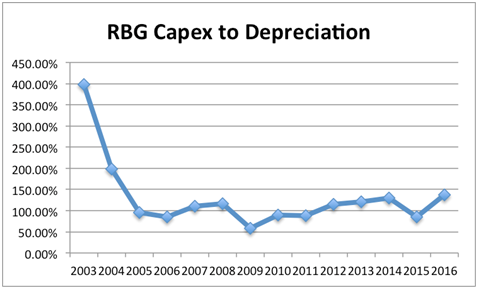
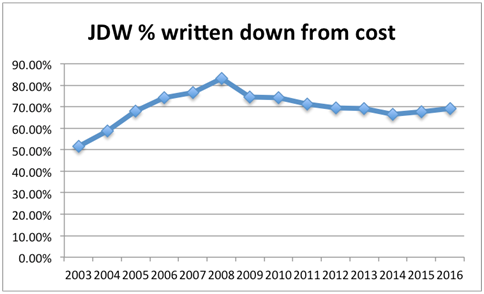
We can see below that RBG's fixtures and fittings assets are heavily written off.
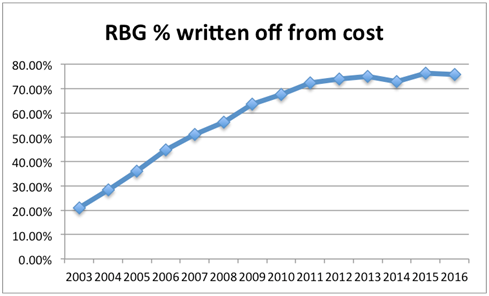
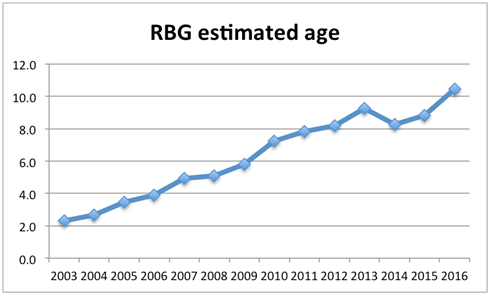
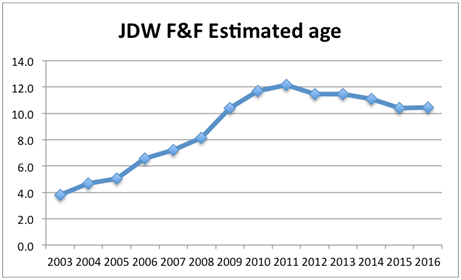
Also, the average age is over the 10 year maximum useful life stated in the accounts. My guess is that RBG's core bar estate is well invested but its non-core bars might not be. It may well have to spend some money on them in the years ahead as leaving them uninvested until the end of their 25 year lease agreements might not preserve the current level of sales and profits coming from them.
JD Wetherspoon
JD Wetherspoon used to be the benchmark setter in terms of prudent depreciation policies. During the early 2000s it was writing off the value of its fixtures and fittings assets at 13-14% per year.
This would have left them fully depreciated in 7-8 years. Now it has one of the lowest depreciation rates in the sector. Possibly because it has some fully written off assets but maybe because it has a depreciation problem as well.
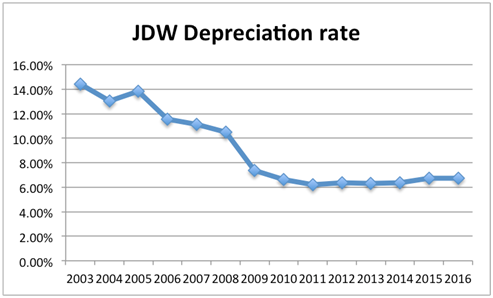
The company went through a very low period of capex spending on new assets - considerably lower than its depreciation charge. Capex has been higher in recent years.
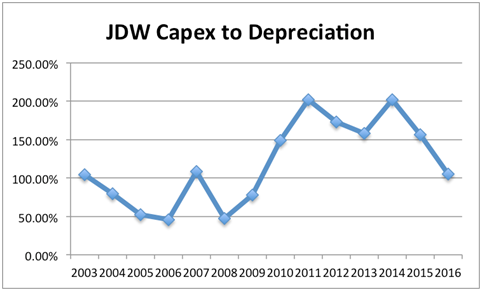
Lower capex than depreciation has seen JDW's assets become significantly written down and what looks to be a very old asset base likely in need of some care and attention.
JDW's accounts are a good read and contain lots of useful information. It always tells readers how much money it spends on its existing pubs and prides itself on keeping them in excellent conditions.
The table below shows the following:
- Maintenance capex spent on existing bars. My guess is that most of this maintenance capex is spent on replacing fixtures and fittings.
- The total amount of fixture and fittings capex for existing and new bars.
- The reported fixture & fittings depreciation.
- Maintenance capex as a percentage of depreciation.
| Year (£m) | Maintenance capex | F&F capex | F&F depreciation | Mcapex as % of Dep. |
|---|---|---|---|---|
| 2011 | 38.4 | 42.1 | 20.8 | 185% |
| 2012 | 45.2 | 41.0 | 23.6 | 192% |
| 2013 | 40.9 | 40.9 | 25.9 | 158% |
| 2014 | 56.2 | 58.3 | 28.9 | 195% |
| 2015 | 44.8 | 53.1 | 33.9 | 132% |
| 2016 | 33.5 | 37.9 | 35.9 | 93% |
If this is true then JDW's fixtures and fittings depreciation is understated and its profits overstated. If you want to try and work out JDW's true profits then you need to pay closer attention to the cash it spends on maintenance capex.
A further word on maintenance capex
An increasing number of companies are telling investors how much money they are spending on maintaining their assets (maintenance capex or stay-in-business capex). This is welcome but needs to be treated with care.
A pub company can present its underlying free cash flow performance in a positive way by showing that maintenance capex is less than its depreciation charge. However, it needs to be remembered that maintenance capex applies only to the pubs it was spent on whereas the depreciation expense applies to all the pubs. Maintenance capex will also not be the same every year. A pub company could be maintaining some pubs whilst neglecting others.
EBITDA returns on cash spent
My view is that if you are going to look at company profitability and company returns it has to be based on an amount of money that is freely distributable to investors. EBITDA does not meet this criterion because depreciation is a real expense. Assets do not last forever and have to be replaced.
There is also plenty of evidence that the LFL sales and profit performance of pubs is significantly impacted by the amount of money spent on them. You can't take the credit for improving sales without paying the bill for them in the form of depreciation and the associated capex that goes with it.
Pub companies talk a lot about the EBITDA returns they are getting on the cash they are investing. These are often big numbers ranging from 25% to 40%. This can lead some investors to get excited that the financial returns of a pub estate can be transformed and that pubs can go from low or modest returning assets to very high returning assets.
I think this is the wrong conclusion. First and foremost, companies often take the uplift in EBITDA after refurbishment as a percentage of the money spent on refurbishing it. This is not the same as the total EBITDA returns for the pub or bar as a whole.
More importantly, the EBITDA and the assets do not last. Evidence suggests that their lives are getting shorter. Running pubs is akin to painting the Forth Bridge, you finishing refurbishing them and then you have to start again - you have to keep spending the depreciation.
For those of you who respectfully disagree with me on this, I'd point you towards the actual EBITDA (profits before depreciation) returns on cash spent (gross tangible assets before depreciation deducted) and say they are nothing to write home about. RBG is probably the best of a bad bunch but I'd say that there are a lot better homes for investors' money than pubs.
| 2016 | EBITDA (adj.) | Avg gross assets | EBITDA % |
|---|---|---|---|
| RBG | 15.6 | 104 | 14.9% |
| MAB | 431 | 4,927 | 8.75% |
| JDW | 175 | 1,918 | 9.12% |
| Lease adj. | EBITDA (adj.) | Avg gross assets | EBITDA % |
| RBG | 24.5 | 166 | 14.72% |
| MAB | 431 | 4,927 | 8.75% |
| JDW | 175 | 1,918 | 9.12% |
In my opinion, investors are better served by using measures such as EBIT or cash profits which at least make some allowance for the fact that assets do not last forever and need to be replaced.
If you have found this article of interest, please feel free to share it with your friends and colleagues:
We welcome suggestions for future articles - please email me at analysis@sharescope.co.uk. You can also follow me on Twitter @PhilJOakley. If you'd like to know when a new article or chapter for the Step-by-Step Guide is published, send us your email address using the form at the top of the page. You don't need to be a subscriber.
This article is for educational purposes only. It is not a recommendation to buy or sell shares or other investments. Do your own research before buying or selling any investment or seek professional financial advice.