Tutorial: Transactions
In this tutorial we are going to look at the Transaction view and what information it shows and also how to add, record, edit and delete various transactions in SharePad:
The Transaction View
The Transaction view shows details of the transactions you have recorded in your portfolio.
You are able to see a breakdown of the individual buy and sell transactions along with any dividend payments, splits and consolidations.
In addition to this it also keeps track of the cash you hold as part of the portfolio.
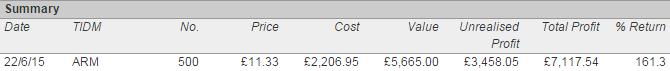
Details for your transaction that are shown include: the number of shares you hold, the price paid per share, the cost of the purchase, the current value, the profit (both unrealised and total) and the % return.
You are also able see the current situation of the portfolio as a whole and how it has performed today and over 1 month, 12 months and the year to date.
The Transaction view also shows a graph of the Portfolio value and this can be set to also show an index or other security in comparison.
Selecting the Transaction View
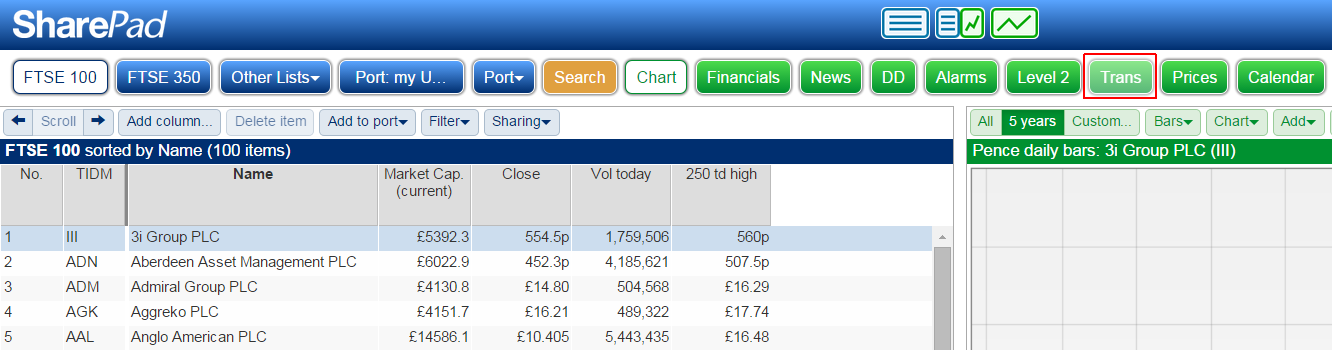
If you are not in a portfolio, you will not be able to access the transaction view as the Trans button will be inactive.
Select one of your portfolios, and the Trans button will become active. If you are unfamiliar with SharePad's portfolio features, please refer to our tutorial, Portfolio Basics.
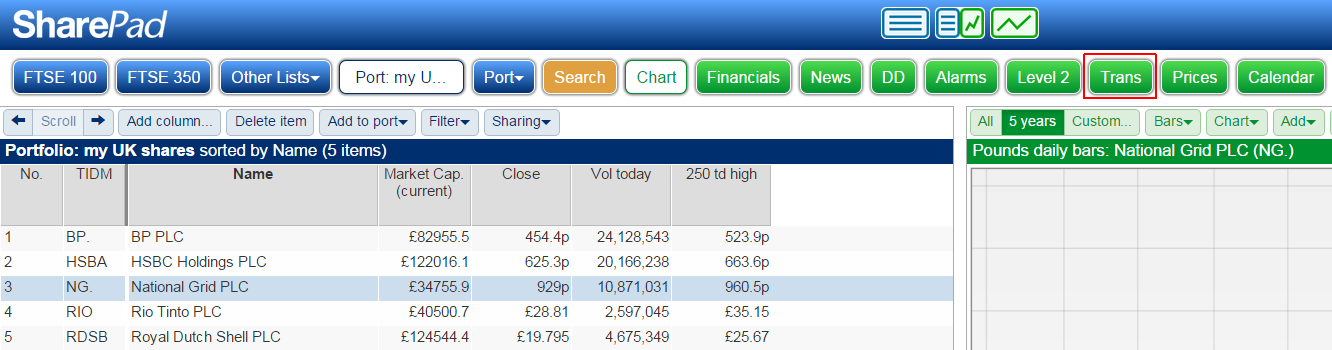
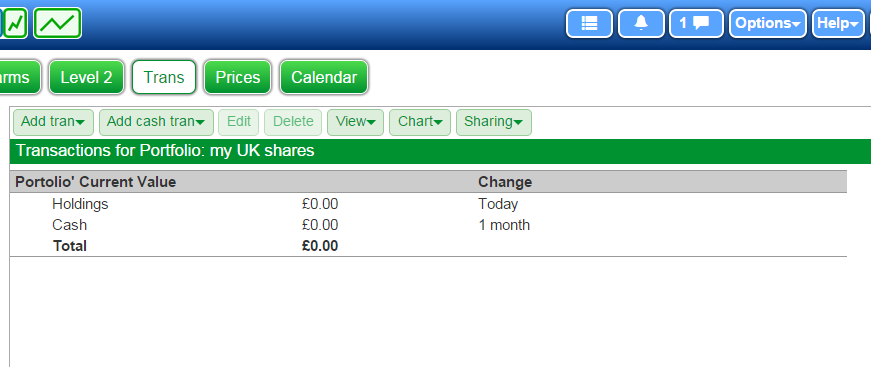
Click the Trans button to view the Transaction screen.
Recording Cash transactions
SharePad has been programmed with customers who hold shares in ISAs and SIPPs in mind. Because of this it is expected that you will have paid cash into your account before you have made any purchase of stocks or other securities.
In SharePad when entering a record of your transactions the first thing to do is to add a Cash balance to your account. To do this click on the Add Cash Tran button and then select Credit from the menu.
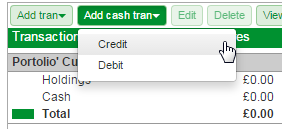
This will open the Add a cash transaction dialog.
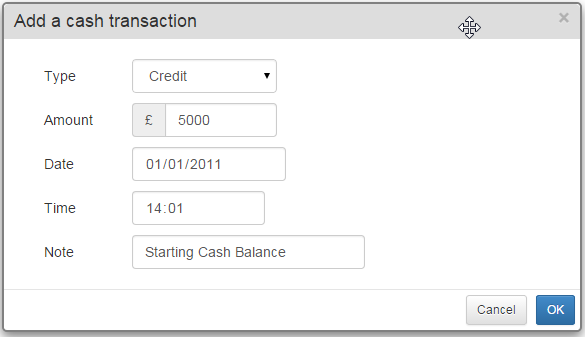
From here you can set the Amount, date, time and add a note if you should wish.
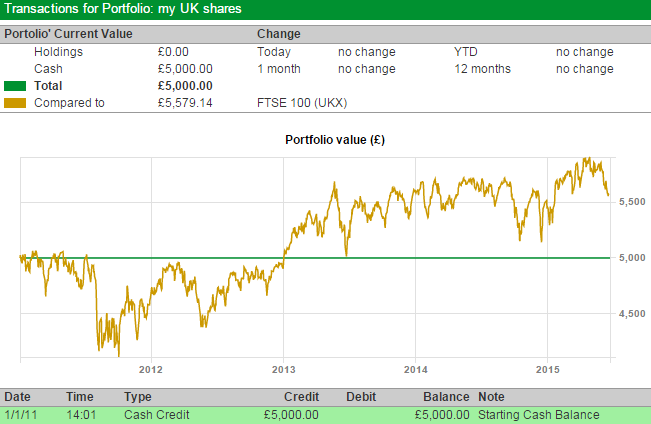
When you add cash you'll notice that SharePad will show a graph that shows the performance of your portfolio as a chart and compares it to the performance of the FTSE 100. The comparison assumes you are investing your cash into the FTSE 100. Any further cash entries will are also assumed to be invested in the FTSE 100 for the purpose of the comparison.
Recording Purchase and sale transactions
Once you have your cash entered into your portfolio you can start recording you purchases and sales.
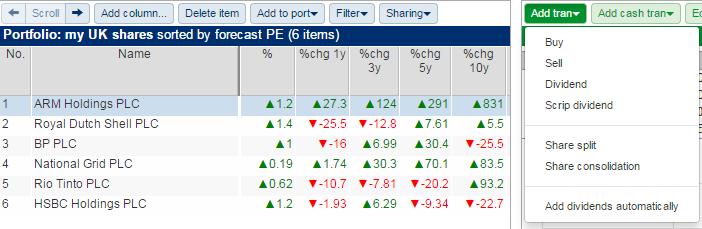
Make sure you have the correct share selected on the blue side of the screen and then click on the green Add tran button and select Buy from the menu.
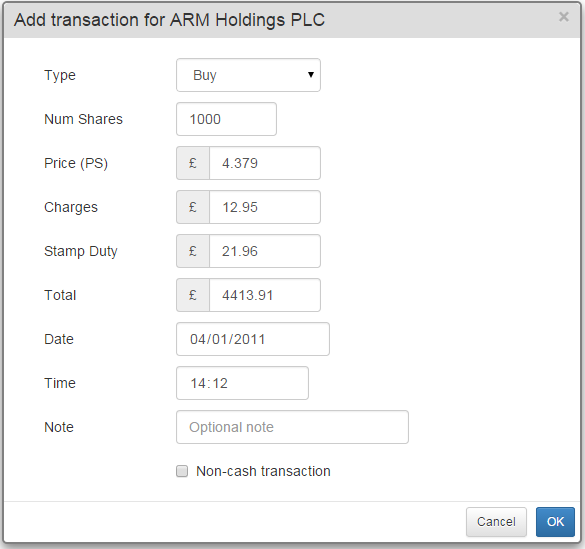
The dialog allows you to set them Number of Shares and the Price per share, not this is in Pounds sterling not pence. It allows you to set Charges, Stamp Duty, the Date, the Time and an option note.
The Total is calculated by the software depending on the other values you enter.
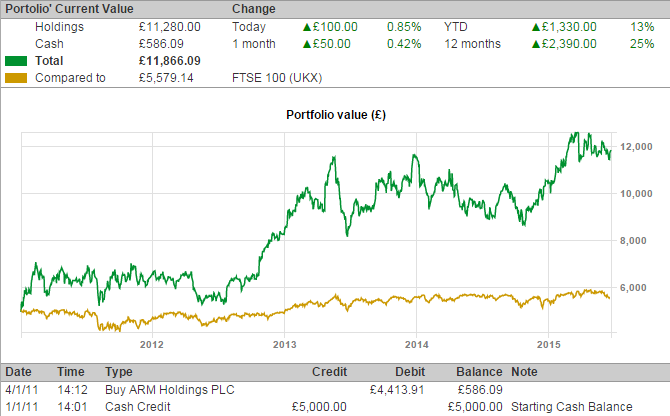
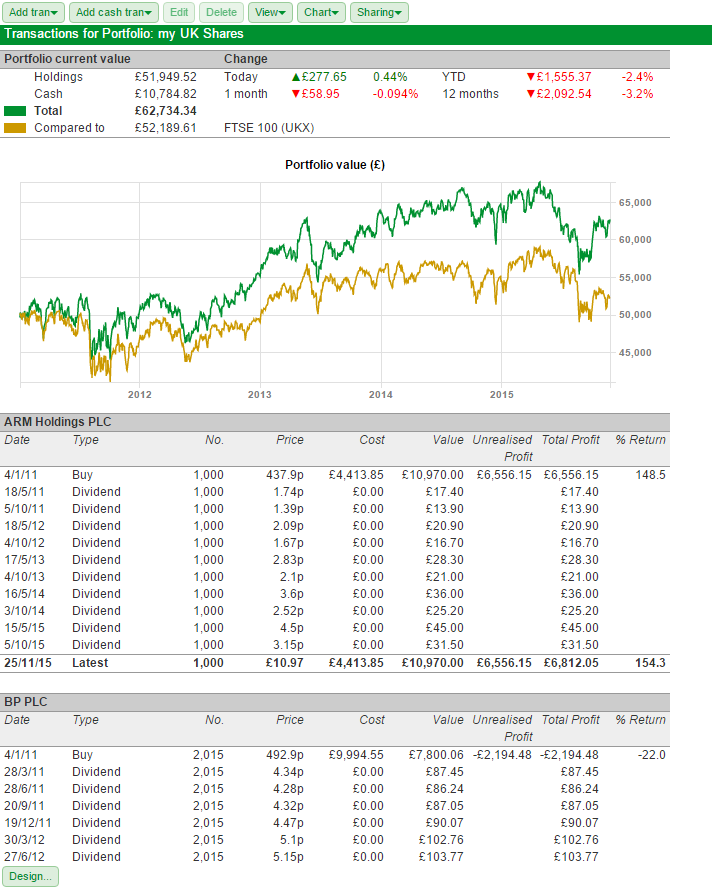
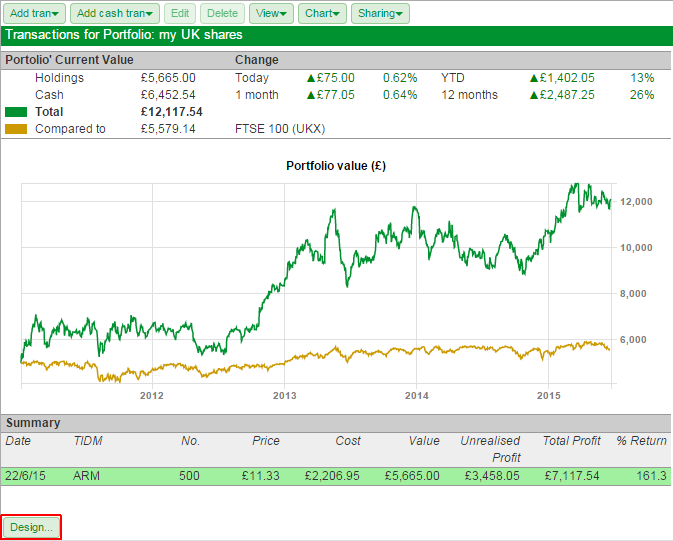
Now that there is a purchase of Arm Holdings the Value chart can track the performance of that holding compared to the FTSE 100.
Above the chart you can see the value of the holdings, cash and the Total value of the portfolios. You can also see percentage change figures for 1 day, 1 month, 12 months and YTD (Year To Date).
In this example the value of the holding in Arm is worth now worth over twice the purchase cost. You can record a sale of the share in much the same way as you recorded a buy. Make sure you have the correct share selected on the Port screen. Select the green Add Tran button and then Sell.

In this example we have chosen to sell half the original holding in Arm.
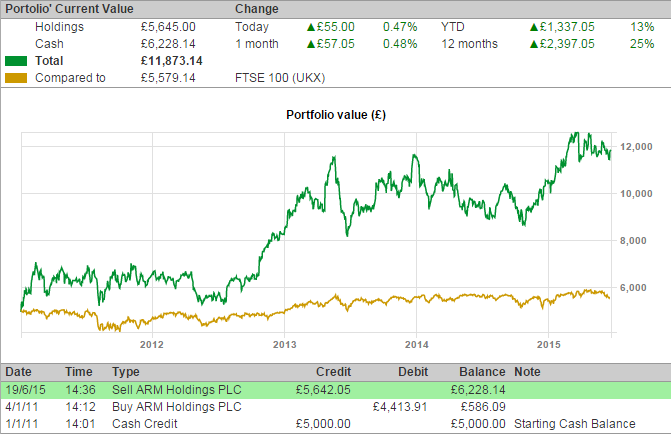
As the sell was recorded on the last trading day not much has happened to the portfolio details. Although you can clearly see that we now have £6,228.14 to invest in other securities.

Automatic Dividends
If you record a purchase of a stock in SharePad then, going forwards, the program will offer to add any dividends paid to you provided you hold the stock before the Ex-Div date.
In the case where you are recording historical purchases SharePad does not automatically add any dividends paid to while you have held the stock. However, you can ask it to do so.
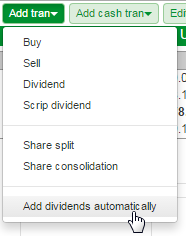
Select the Add tran menu and then Check for dividends from the bottom of the menu.
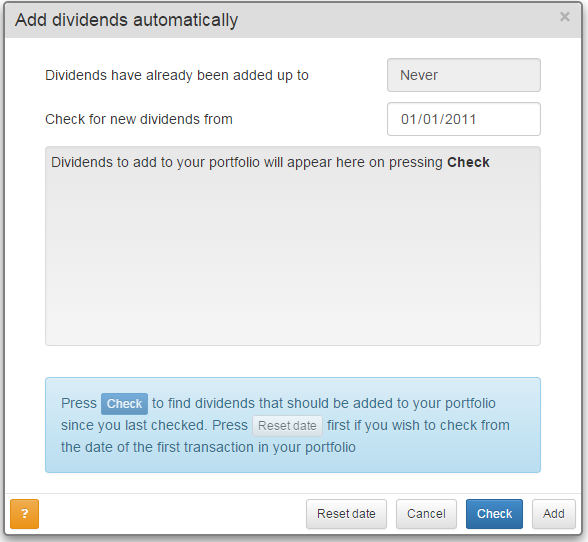
The dialog allows you to set the date from which you are checking for dividends. Because we have never checked for dividends it is using the date of the first transaction in our portfolio which is when we add the cash to the portfolio.
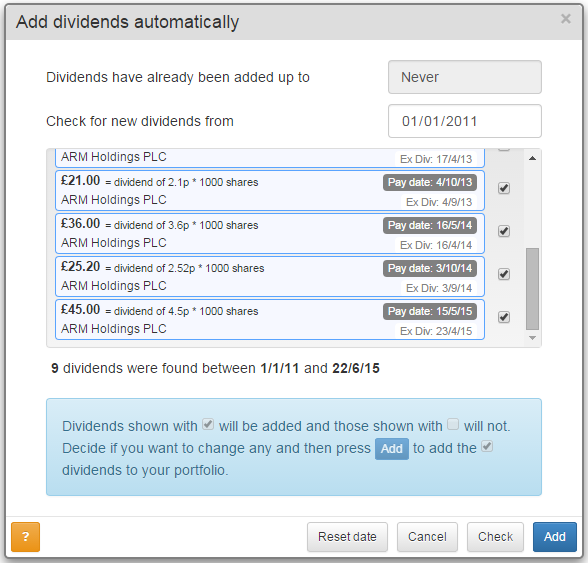
When you click on Check the dialog will show you all the dividends to be added, how many in total and between what dates.
You can choose to tick or untick any of the dividends and then, once you are happy click on Add.
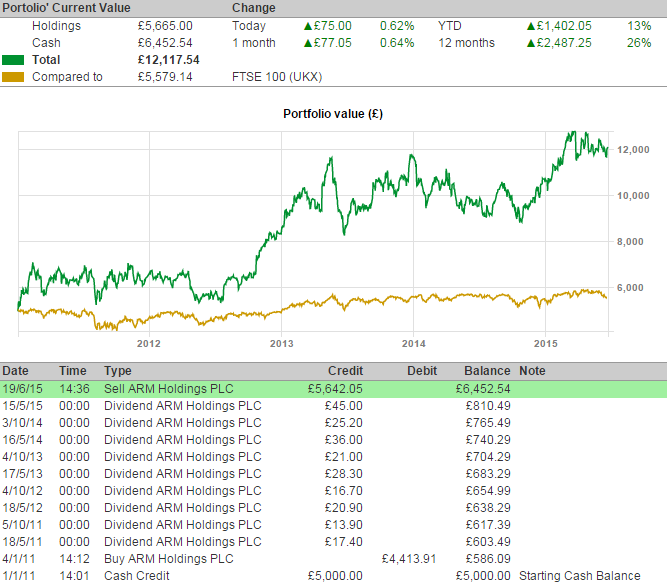
You can see all the dividends have now been added to the portfolio, increasing the amount of cash available for future purchases.
Manually recording dividends
Dividends can also be recorded manually in the Add tran menu there are options for both Dividend and Scrip Dividend.
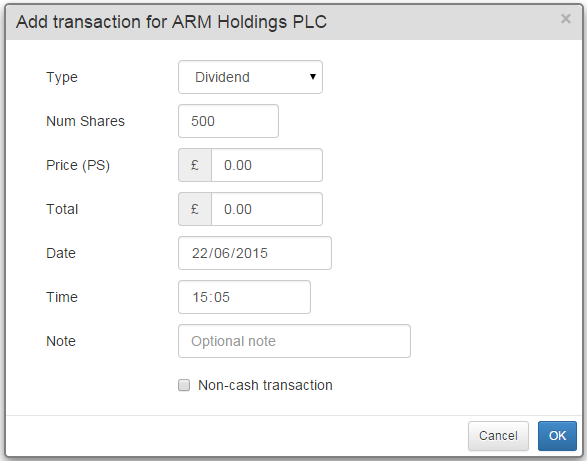
The Add Dividend dialog allows you to specify a number of shares, price per share (in pounds), the date, time and a note if you wish to add one.
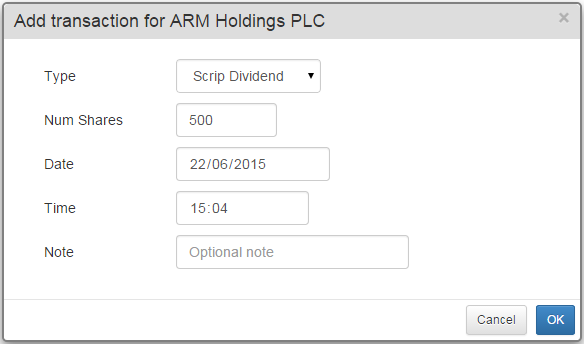
The Add Scrip Dividend dialog allows you to enter a number of shares and the date, time and a note.
Editing and Deleting a transaction
There are buttons to the right of Add tran and Add cash tran that enable you to Edit and Delete a transaction.

Make sure you have the correct transaction highlighted in green before clicking on Edit or Delete. You will not be asked if you are sure when deleting a transaction so make sure you have the correct one selected.
Changing the Transaction view
The green View button gives you several options.
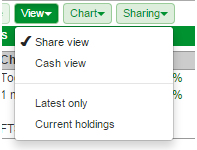
The tables shown above are all shown in the Share View. You can change the Transaction screen to the Cash View.
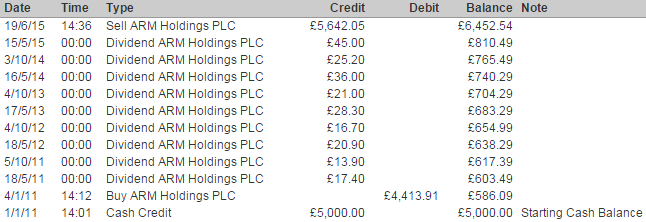
This shows your transactions as a series of Debits and Credits.
Latest only shows only the current position of your holdings removing all of the individual transactions from the table.
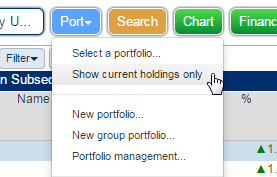
Current holdings removes details of any shares where you have sold your entire holding.
The Current holdings option for the Portfolio side of the transaction screen is found by clicking on the blue Port button.
Note: Current holdings and Latest only can be selected together but they only apply to the Share view.
The Transaction Chart
There are two ways to change the Transaction chart in SharePad.
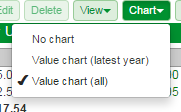
The green Chart button allows you to toggle between No Chart, Value chart (latest year) and Value chart (all).
The charts above have all been set to all.
You can also click on the green Design button at the bottom left hand corner of the green window.
By clicking on Design... you get access to options to change what the graph is plotting, the colours of the lines and even the instrument used for comparing the portfolio performance.
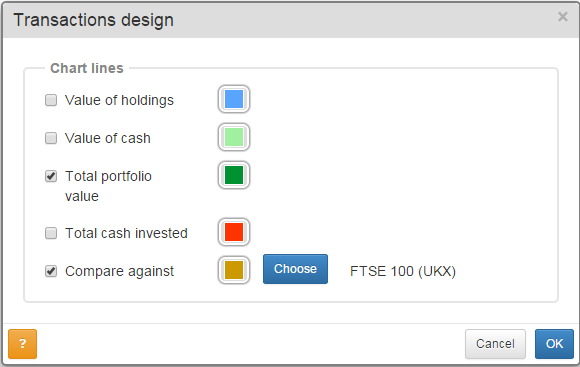
If you don't wish to keep a track of your cash, for example, you can deselect Total Portfolio value and select Value of holdings instead.
Note that the dialog has a ? (question mark) button. You can always click on these to get more help when you see them.