Tutorial: Candlesticks
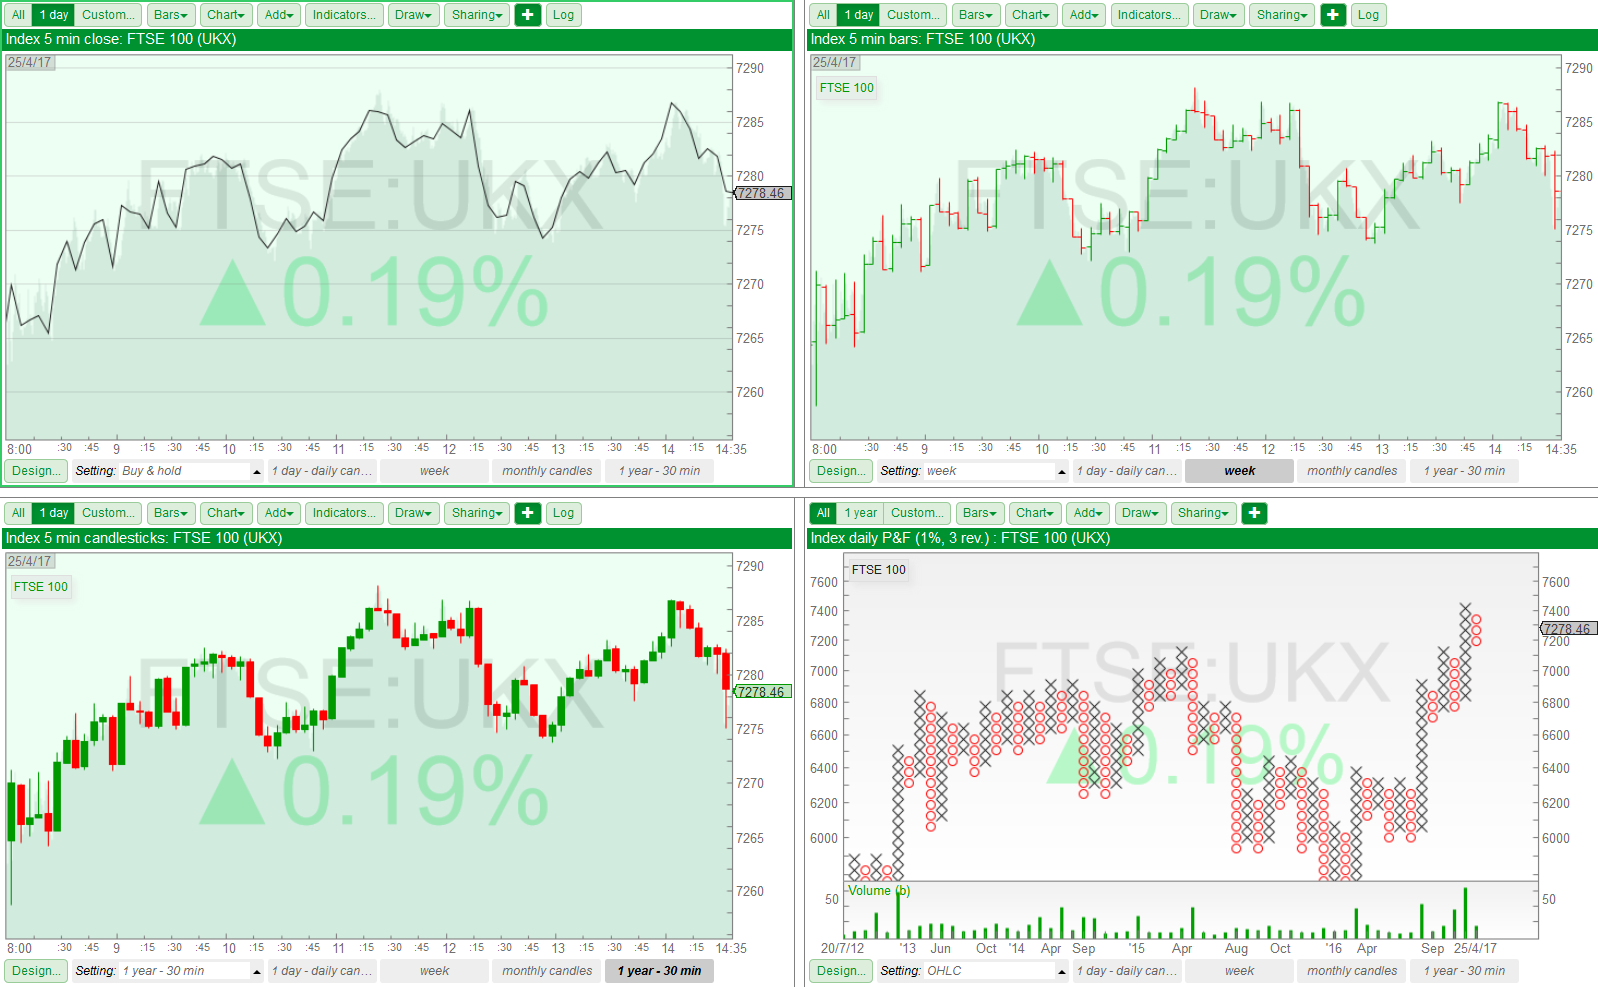
The most common types of charts in SharePad are displayed below (clockwise from the top-left: Close line, Open High Low & Close bar (OHLC), Point & Figure and Candlesticks):
A candle, or candlestick, is similar to a bar in that it represents the range of trading during a given chosen. It is called a candlestick due to its similarity to a wax candle with a protruding wick.
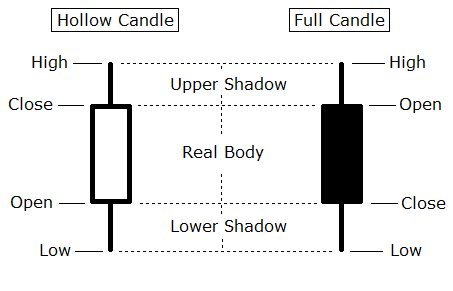
A candlestick is made of three parts: a body and an upper and lower shadow (often referred to as a wick).
- If the candle has closed higher than it opens, then it is drawn with a hollow body and is said to be a rising candlestick.
- If the candle has closed lower than it opens, then it is drawn with a filed body and is said to be a falling candlestick.
The wick represents the full range of trading for the period covered by the candle.
Displaying and customising candlesticks in SharePad
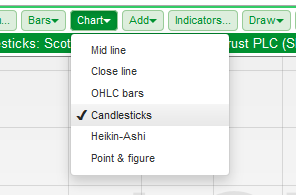
There are two different ways to display candlesticks on a chart in SharePad. In the Chart view, click on the Chart button and select Candlesticks from the drop-down menu.
Alternatively, click on the Design... button located near the bottom-left corner of the Chart view and from the dialog box, select Candlesticks as the Main chart type.
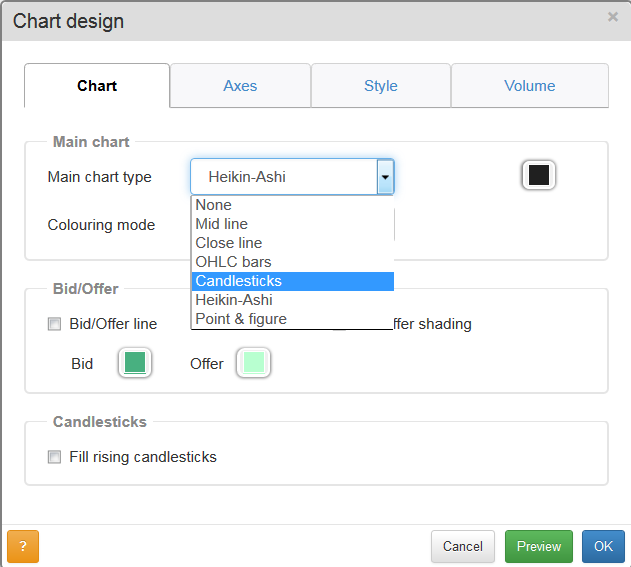
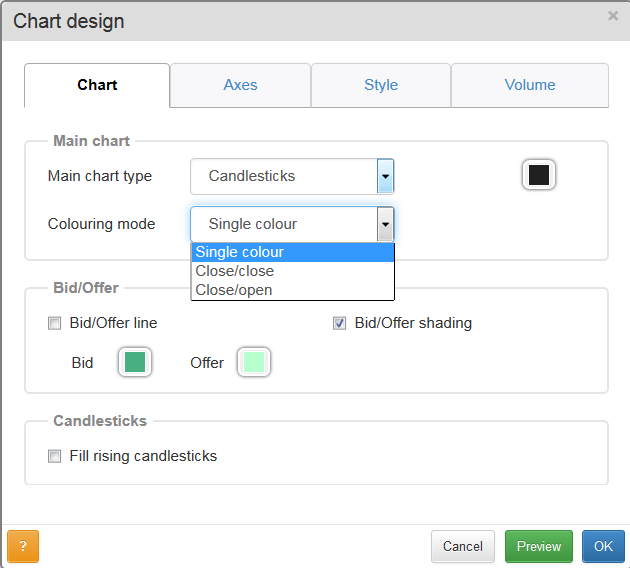
By default, Single colour will be displayed as the Colouring mode. Click on the drop-down menu to see two options:
- Close/close - colouring is based on the Close relative to the previous day's Close
- Close/open - colouring is based on the Close relative to the same day's Open
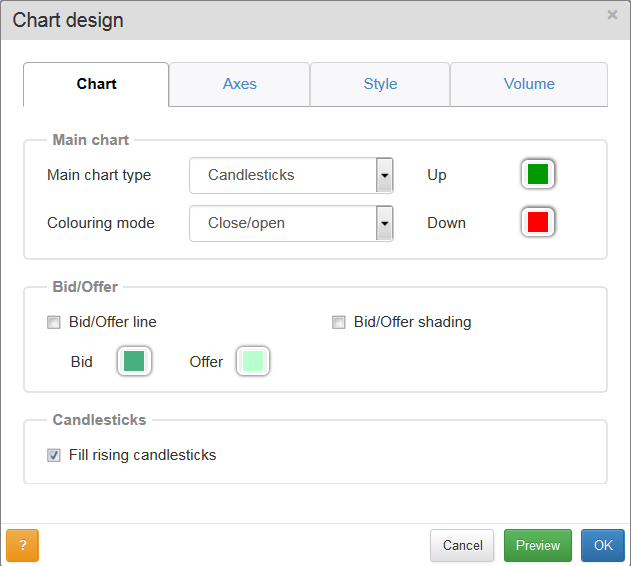
Selecting one of these options will enable you to select the colouring of the Up and Down candlesticks.
To show filled candlesticks, tick Fill rising candlesticks. and press OK.
Click here for a quick reference guide to bullish and bearish candlestick patterns in SharePad.