Alpesh Patel: Seven ways I look for opportunities
Here is a summary of the different ways you can use the Alpesh Patel Special Edition:
If you are looking for investment ideas:
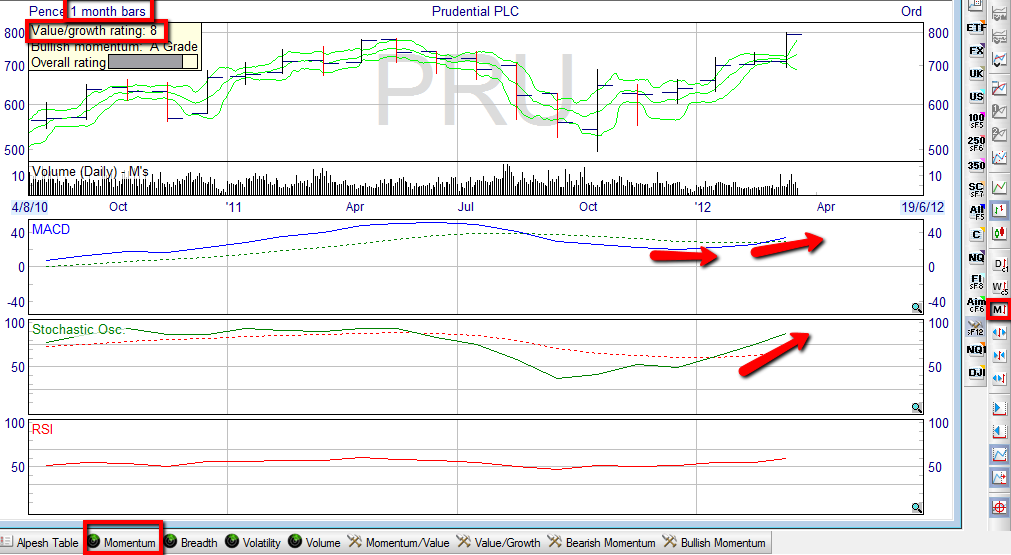
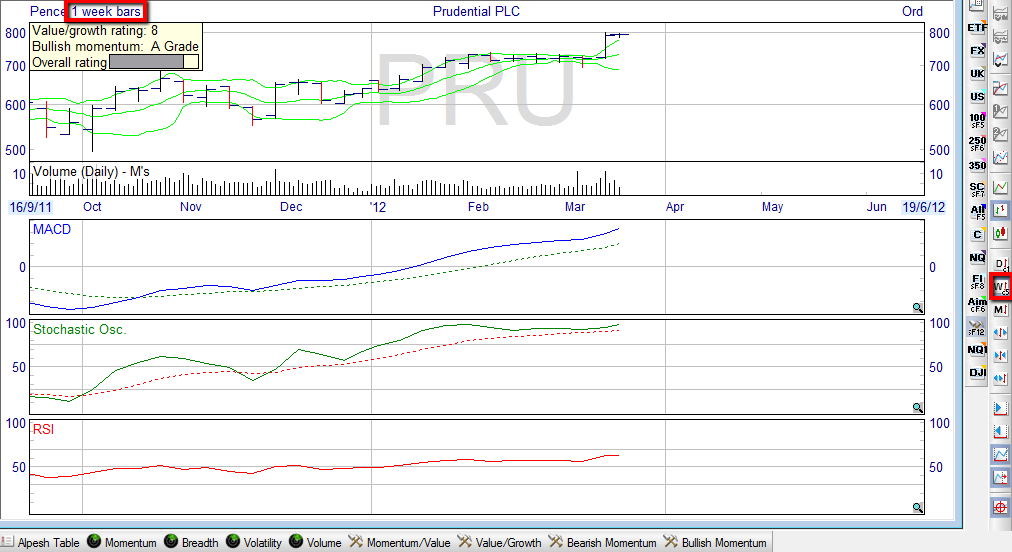
- Use my Value/Growth filter for 12 month buy and hold picks - stocks that show undervaluation and growth. I look at the charts with my Momentum radar to ensure the MACD is rising on the monthly chart or at least moving sideways.
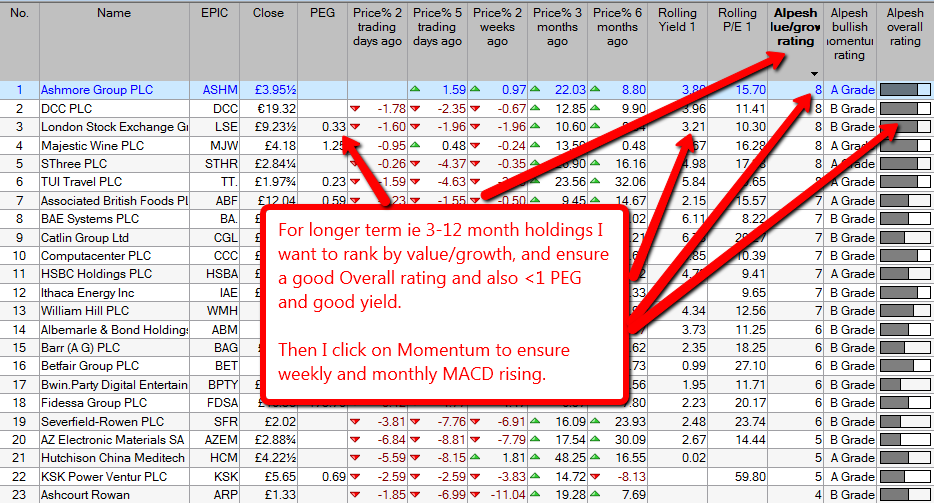
- Or use the Alpesh Table with any list (e.g. FTSE All-Share) and sort by Value/Growth rating or Alpesh Overall rating. Look for highly-ranked companies with a PEG below 1 and the weekly and monthly MACD rising.
If you're looking for trading ideas:
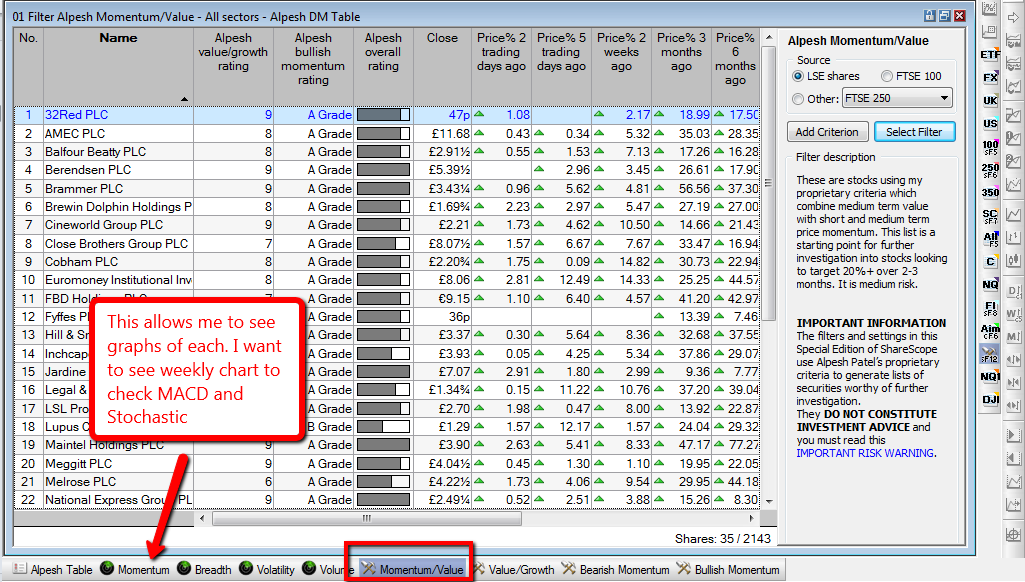
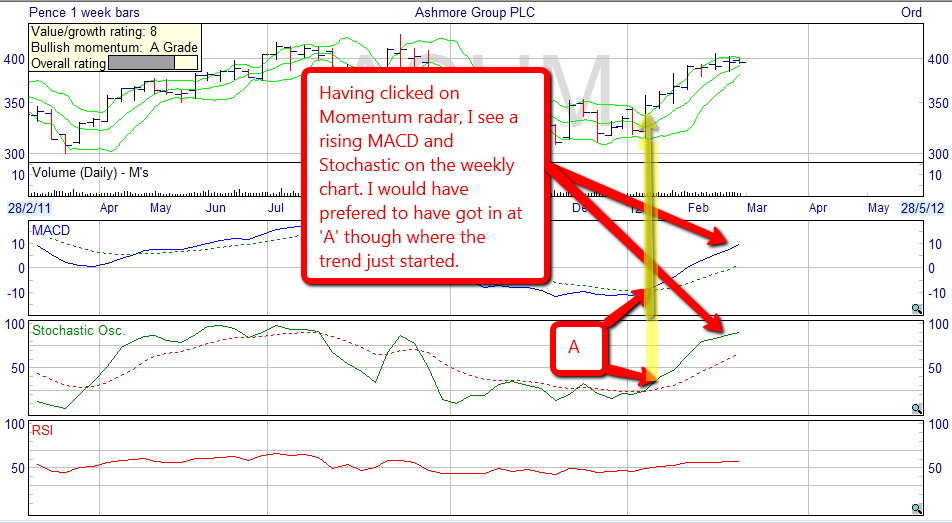
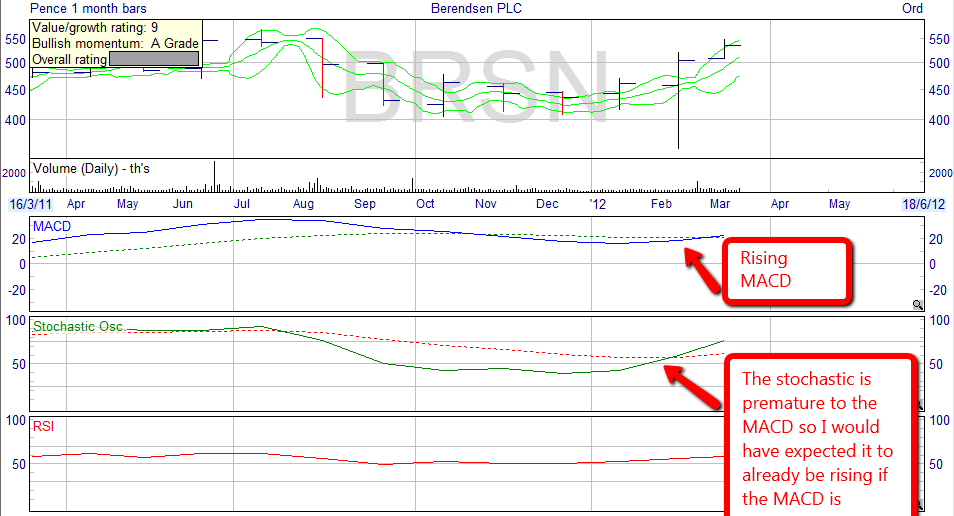
- Look at my Momentum/Value, Bullish Momentum and Bearish Momentum filters. Look at each opportunity with my Momentum radar. You will not find in these lists every stock that has gone up recently - it is a shortlist to save you time. I run through each stock in the graph view to see which I like best. I want to see the weekly MACD flat or rising for a bullish signal and Stochastic having risen and still rising.
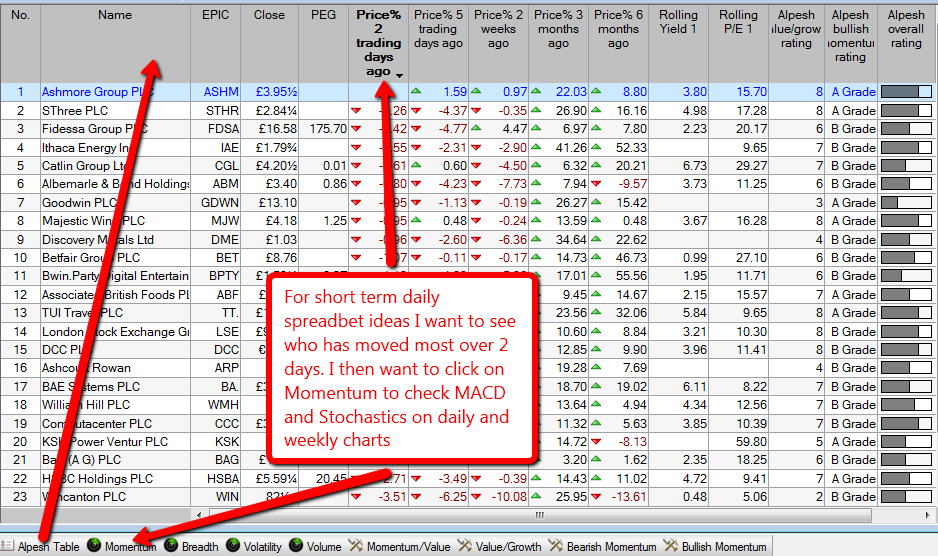
- Use my Alpesh Table and sort by 2-day % price rise to find the short term movers. Look for rising MACD on daily and weekly charts using my Momentum radar.
- For medium-term trades, use the Alpesh Table and rank by Alpesh Value/Growth rating. Look for a rating of 7-9 and then look for rising weekly and monthly MACD on my Momentum radar.
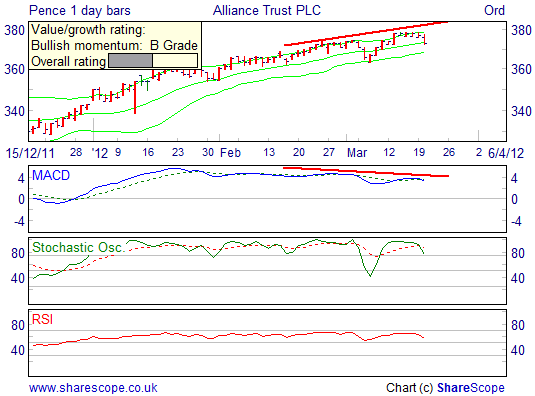
- Use my Momentum radar to scan through any list of stocks, or other instruments (e.g. forex), looking for bullish or bearish divergence (learn more about this in the Momentum Radar section).
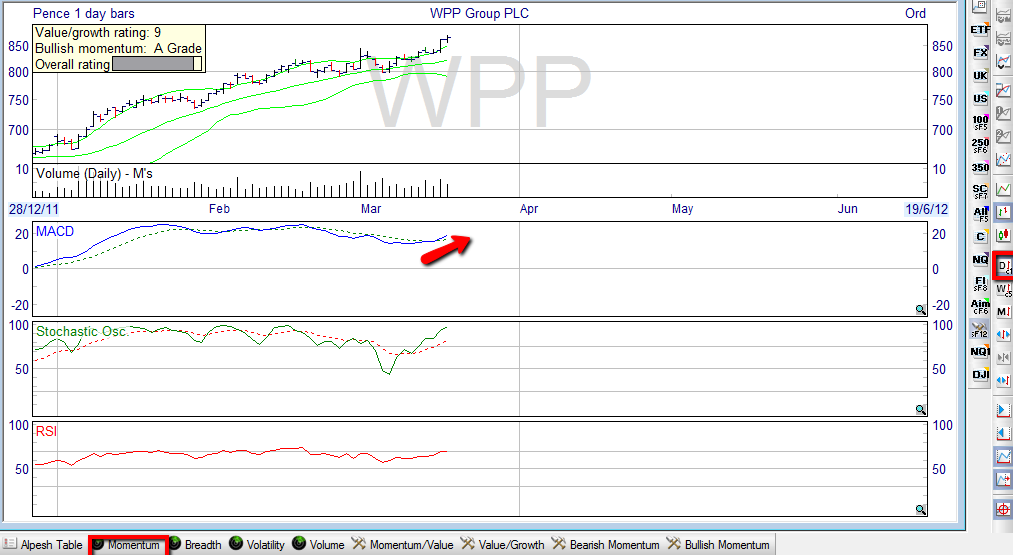
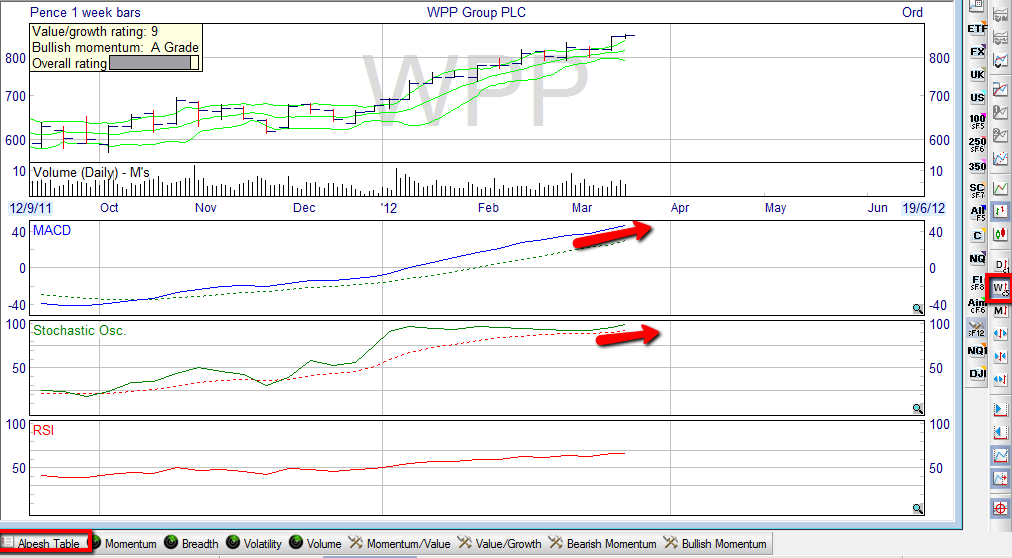
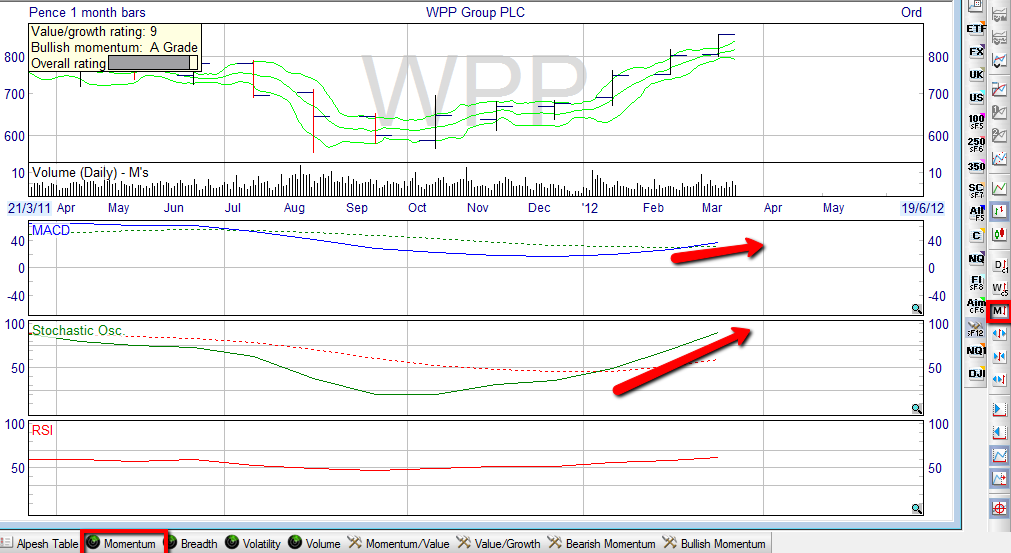
- Look for charts where the daily, weekly and monthly MACD is going up, ideally from a low base - these are mega-trends! On the daily chart, the MACD can be flat to rising, supported by a rising weekly and monthly MACD. This usually means we are going to see a prolonged rally as the daily buyers are supported by the weekly and monthly ones. Ideally the Value/Growth rating should be 7 at least too to give extra comfort that the momentum is supported by fundamentals. WPP below is a good example. The next three charts show Daily, Weekly and Monthly price bars.
