A quick way to find potential stock market bargains
Investing your savings is a serious business but I think it's also important to have some fun from time to time. If you can afford it, having a small amount of money to trade shares can make life more interesting, especially as sensible long-term investing is - and should be - quite uneventful.
When it comes to trading opportunities there are lots of strategies you can follow. One of my favourites is scanning for very depressed shares. This involves looking at companies whose share prices have fallen a long way, so much so that they are despised by some investors and ignored by most.
These are the kind of shares that can become very cheap. Often this is because a company is in deep trouble and so they deserve to be. Sometimes though the market overreacts and throws up a bargain for those of us who are prepared to go against the crowd.
Looking for distressed shares is like panning for gold in a river. Most of the time your pan will be full of worthless grit but from time to time there will be that glimmer of gold that can make you some money.
I like to think of SharePad as my stock market equivalent of a gold pan. It allows me to sift through lots of shares very quickly to see if there's anything worth taking a closer look at. You can do the same in ShareScope.
I am going to take you through some very easy steps on how to do this. All you have to do is add some data columns to a list of shares. In this instance, I have started off by looking at the biggest fallers in the FTSE All-Share index since the start of 2016.
Phil Oakley's debut book - out now!

Phil shares his investment approach in his new book How to Pick Quality Shares. If you've enjoyed his weekly articles, newsletters and Step-by-Step Guide to Stock Analysis, this book is for you.
Share this article with your friends and colleagues:
Falling prices
A sharply falling share price is a clear sign of distress. The bigger the fall, the bigger the potential distress and possible opportunity.
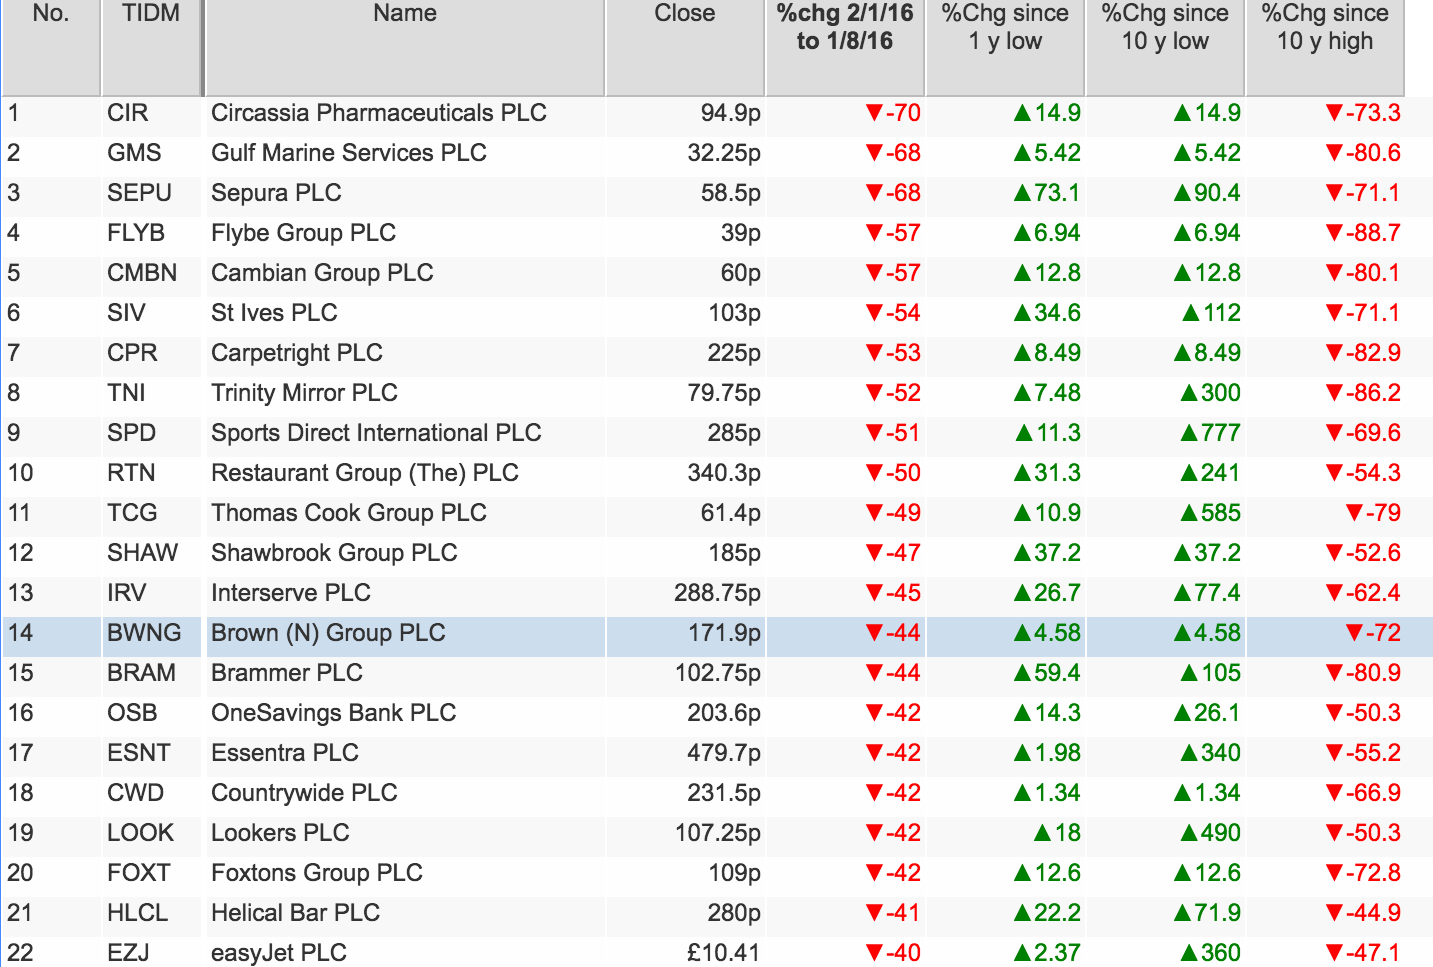
Below you can see that I have ranked the biggest fallers in the FTSE All-Share this year starting with the biggest. There are then a number of other price columns I can add to this list to give me some more useful information.

The first extra column is telling me how far a company's share price is from its one year low. This tells me if the price is at its most depressed for the year or whether it has already bounced and a recovery could be under way. A share price that has already bounced off its low might be attractive to some momentum traders. Others might want to look to buy a share where there is more pessimism baked into the share price and where there has been no bounce.
Share such as Gulf Marine, Flybe, N.Brown, Countrywide, easyJet and Essentra are still fairly close to their one year lows. Others such as Sepura, Brammer and St Ives have bounced strongly off their lows.
Another useful indicator to look at is to see if a share is close to a multi-year low and also how far it has fallen from a long term high. Shares at multi year lows are usually very depressed indeed and could be heading for trouble.
I've asked SharePad to tell me how far away share prices are from their 10 year low. Some shares haven't been around that long, so it is a good idea to look at the price as well.
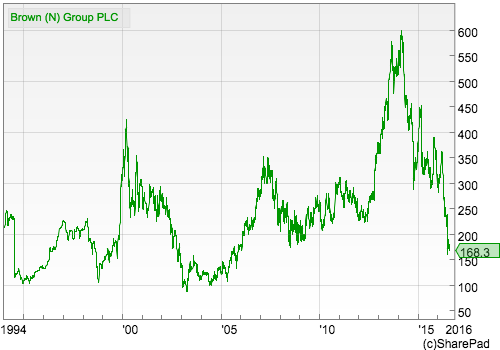
For example, N. Brown's share price is close to its 10 year low. A look at its share price chart is telling me that the shares are trading at similar levels seen in the financial crisis of 2008-09. They have also fallen over 70% from their 10 year high. By the look of things this company is in a bad way.

Are the shares really cheap?
Once you've identified that a share is distressed you need to see if you can pick them up for a low valuation. The cheaper the share, the bigger the buffer you have against being wrong and the bigger the upside you might have if the company's fortunes improve.
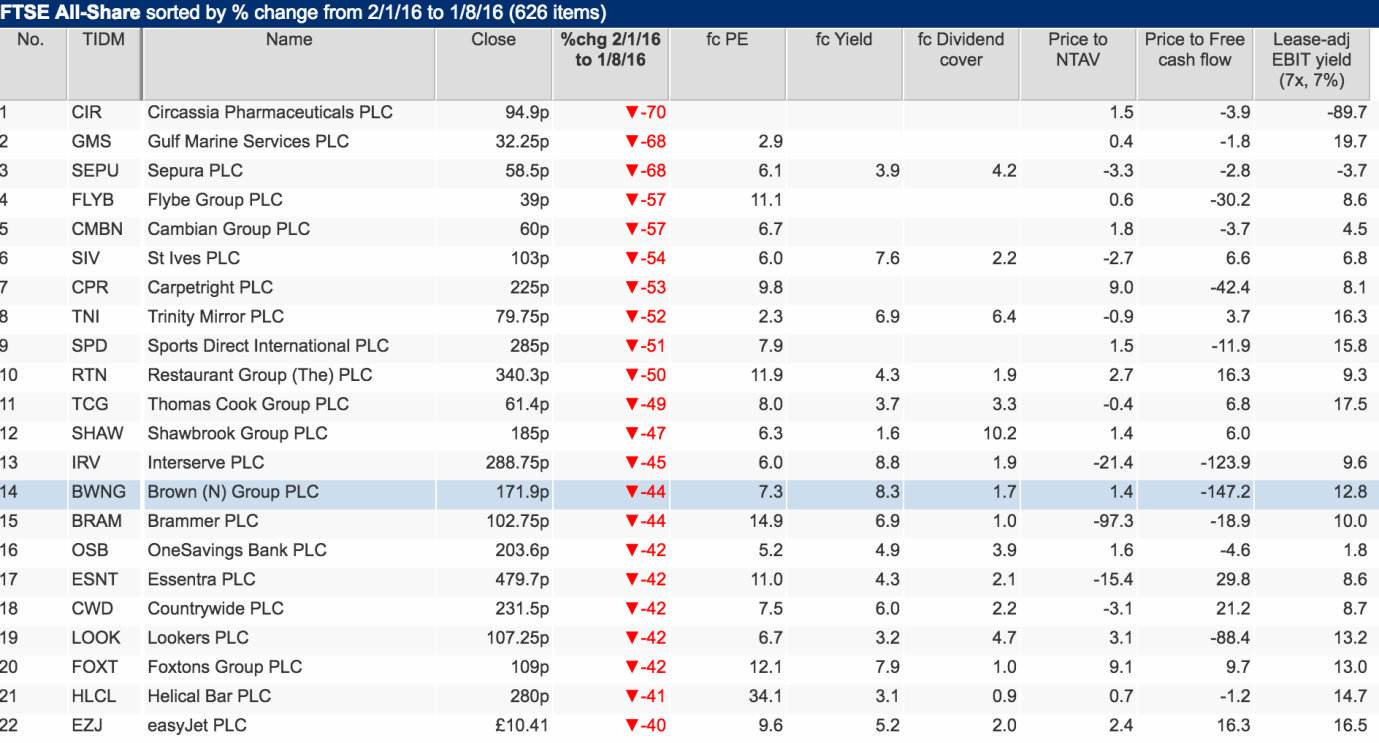
Let's have a look at our list of shares to see how much they are selling for. I've added six columns to the list:
- Forecast PE ratio
- Forecast dividend yield
- Forecast dividend cover
- Price to free cash flow
- Price to net tangible asset value
- EBIT yield (lease adjusted)
If we stay with N. Brown for now, we can see from the table below that its shares trade on just 7.3 times forecast earnings per share and offer a prospective dividend yield of 8.3% with a forecast dividend cover of 1.7 times - if analysts' forecasts prove to be accurate. That looks quite cheap.

An EBIT yield of over 12% based on its last reported profits also suggests that the shares could be cheap. But the price to free cash flow multiple is negative which is telling us the company has not recently produced any free cash flow. This might be a red flag that warns some investors off the shares.
Trinity Mirror shares look even cheaper trading on 2.3 times forecast earnings, a forecast yield of 6.9% which is covered over 6 times. The price to free cash flow multiple is just 3.7 times whilst the EBIT yield is a stonking 16.3%. Why are these shares so cheap? Is the stock market wrong or are these shares cheap because they deserve to be?
How safe are they?
Shares are often cheap for a reason. It is usually because a business is experiencing very tough trading conditions that are expected to continue for some time or there are big financial problems such as big debts or pension fund black holes.
Ideally you should be looking for a reasonable business with a respectable ROCE but without too much debt or a big pension fund deficit. These liabilities become more problematic when a company's profits and cash flows are falling.
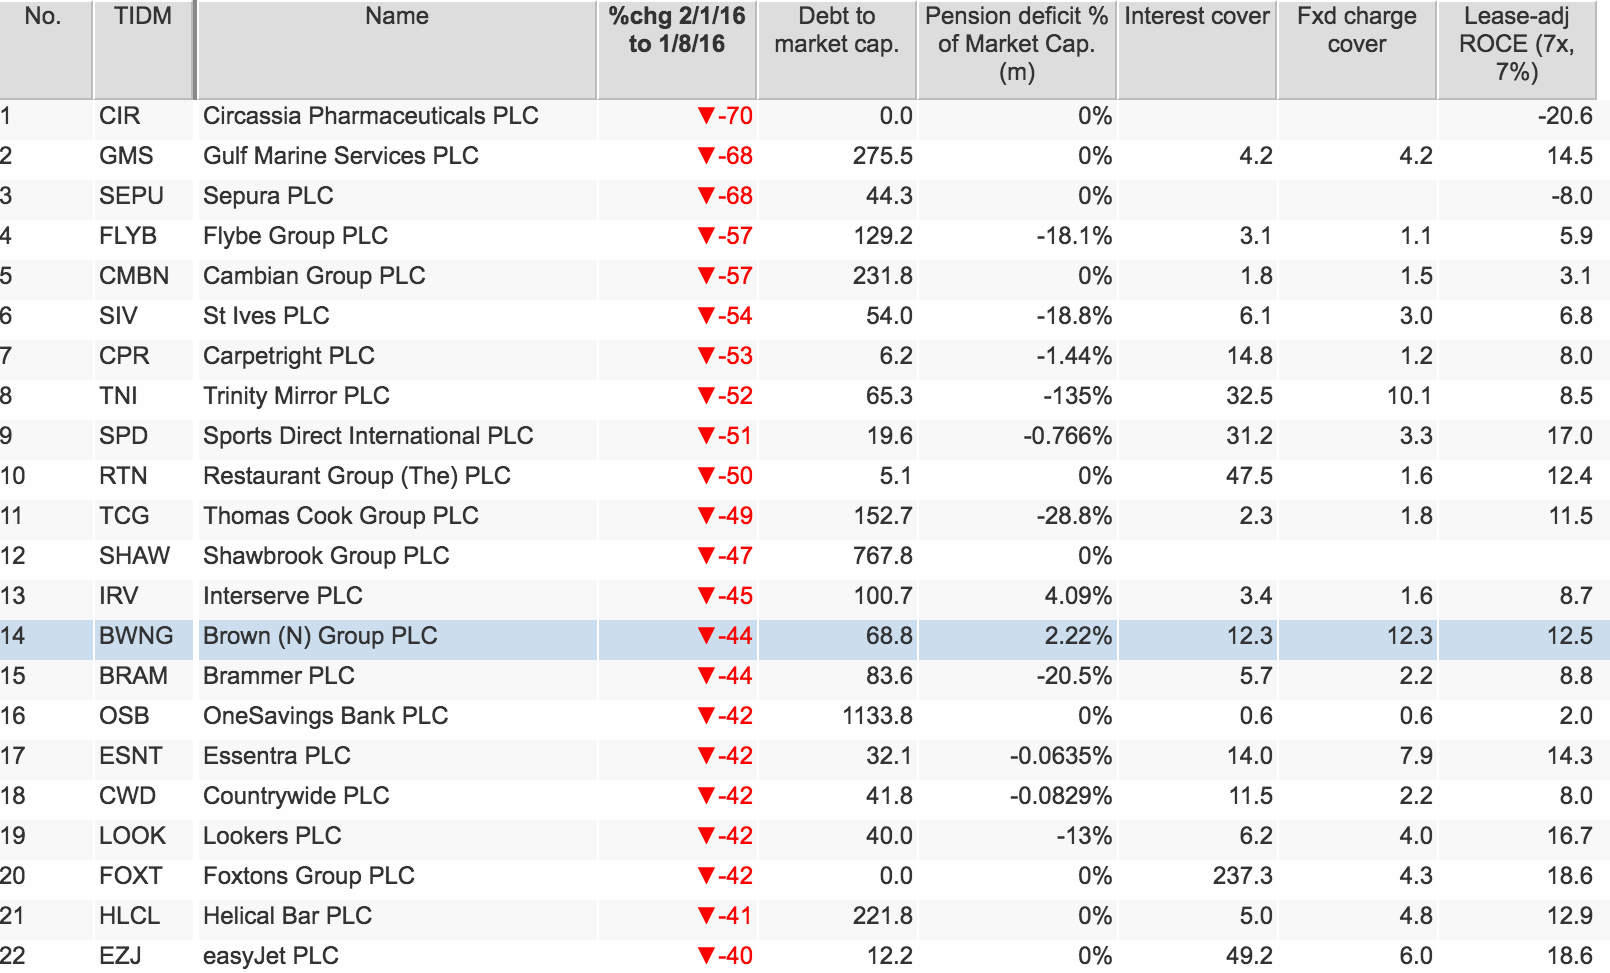
In the table below I've looked at some key safety measures with some minimum thresholds that need to be passed:
- Debt to market capitalisation - the smaller percentage the better. Ideally less than 20%.
- Pension fund deficit to market capitalisation - the smaller the percentage the better. 10% or less.
- Interest cover - the higher the number, the better. More than 5 times
- Fixed charge cover - the higher the number, the better. More than 2 times.
- ROCE - the higher the number the better. At least 10%.

N Brown has high debts but passes the other tests. Trinity Mirror's big pension fund deficit and low ROCE might put some investors off. EasyJet and Sports Direct might be worth a closer look and some more research.
Some key questions to ask
The type of screening I've just shown you can be done in just a few minutes in SharePad or ShareScope. If you have found some shares that you want to take a closer look at you need to answer some key questions before you think about buying them.
In particular:
- Are the company's problems temporary from which it can recover or has there been a permanent change in its business environment? You are looking for temporary difficulties here. An increase in competition is usually a bad sign.
- Have profits bottomed? Things often get worse before they get better.
- Are profits expected to increase? This is the most bullish sign you can get as rising profits and a low valuation are often a sign that a share has been treated too harshly by the market.
- Are dividends increasing? Dividends that have been maintained - rather than increased - are often cut later on.
- Are directors buying or selling a lot of shares? Big insider buying can be a bullish sign.
- Are City analysts universally bearish? This can be a good sign as a change in sentiment by a few analysts can have a big impact on the share price over time. Buying before sentiment changes can be very profitable.
If you have found this article of interest, please feel free to share it with your friends and colleagues:
We welcome suggestions for future articles - please email me at analysis@sharescope.co.uk. You can also follow me on Twitter @PhilJOakley. If you'd like to know when a new article or chapter for the Step-by-Step Guide is published, send us your email address using the form at the top of the page. You don't need to be a subscriber.
This article is for educational purposes only. It is not a recommendation to buy or sell shares or other investments. Do your own research before buying or selling any investment or seek professional financial advice.