Stock Watch: Britvic
In my opinion, one of the best ways to try and find a winning share is to look for a solid business which has temporarily fallen on hard times. The stock market doesn't like bad news and often shuns companies that can't keep on delivering higher profits year after year. This can sometimes allow you to pick up the shares of good companies at very good prices - providing there is scope for it to recover.
I spend a lot of time looking for shares hitting new lows in the hope that there might be a gem that the market has cast aside. Recently, I have extended my search from 52 week lows to three and five year lows as a sign of poor investor sentiment towards shares.
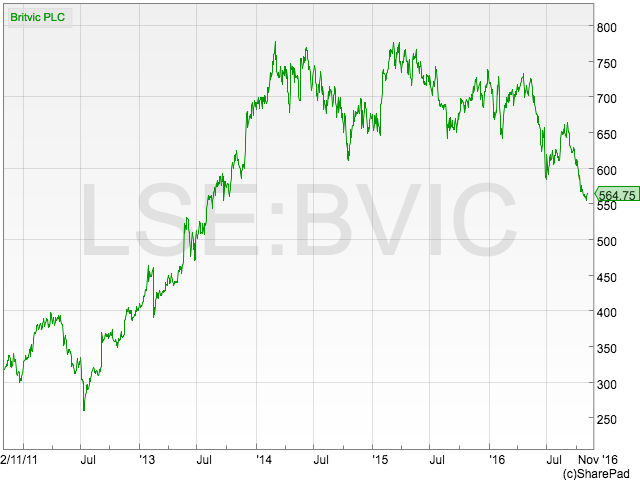
Shares of UK soft drink maker Britvic (LSE:BVIC) have recently touched a three year low. For all I know, there could be a very good reason for this. But occasionally you can unearth a share that can bounce back.
In this article, I am going to take a closer look at Britvic to see if it might be a share that warrants some more thorough research.
Phil Oakley's debut book - out now!

Phil shares his investment approach in his new book How to Pick Quality Shares. If you've enjoyed his weekly articles, newsletters and Step-by-Step Guide to Stock Analysis, this book is for you.
Share this article with your friends and colleagues:
Is it a good business?
Before you get concerned with any numbers, take a little bit of time to understand what a company does to make money. This initial investigation can often give you a feel for a business and whether you want to carry on researching it.
Britvic is a very easy business to understand. It produces and sells soft drinks including some very well known brands such as Robinsons, Tango, J2O and Fruit Shoot. It also has an exclusive licence to produce and sell Pepsi and 7UP in the UK and Ireland.
The UK is by far its most important market where it is the leading seller of still soft drinks such as water, juices and squashes. It is the number two seller of fizzy (carbonated) drinks behind Coca-Cola.
France is the company's next biggest market, followed by Ireland. The company is trying to expand further internationally in places such as the USA and Brazil.
Britvic is selling brands that have been around for years and are very popular with consumers. These kinds of companies tend to be very popular with investors as a portfolio of brands can mean regular purchases and predictable profits and cash flows.
Yet Britvic shares have just touched a three year low whilst many branded consumer goods companies are close to all time highs. What is different about Britvic?
Before we try and find out, we'll have a look at its historic financial performance.
You can quickly get a feel for whether a business is any good or not by looking for consistency in four key areas of its financial performance.
- Profit margins
- Return on capital employed (ROCE)
- Free cash flow
- Dividend growth
If you are SharePad user, you'll find all four of these in the new financial charts feature on the Summary tab of the Financials view.
Profit margins
Consistently high profit margins are often the hallmark of a quality business. They are a sign that a business has been able to withstand the threats of competition and weather economic storms. As a rule of thumb, I consider profit margins of 15% or more to be high.
High profit margins also protect the business and the shareholder. They show that profits can fall by a reasonable amount before it gets into trouble. Businesses with low profit margins do not have that safety net.
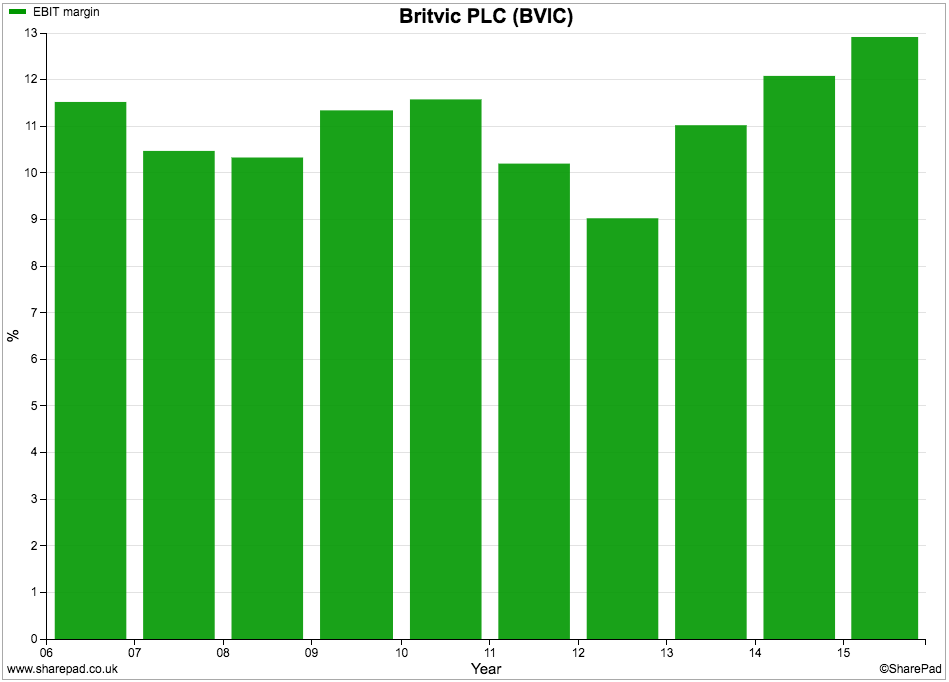
Britvic's profit margins have been consistently above 10% for most the last decade and have been on a rising trend for the last three years. They do not quite hit my high margin threshold but they are not far off.
When you are researching a company, try and get into the habit of asking some simple questions about a company's profit margins such as:
- Can prices increase?
- Are costs increasing or decreasing?
- Is the company likely to sell more or fewer products?
These trends within a company have a major impact on whether profit margins will go up or down. We'll take a closer look at this shortly.
Return on capital employed (ROCE)
High profit margins are a good sign, but they don't take into account all the money that has been invested in the business to make those profits. ROCE does this. In my opinion, high-quality companies consistently produce ROCE of 15% or more including returns on hidden debts such as rented assets. Above 20% is very good.
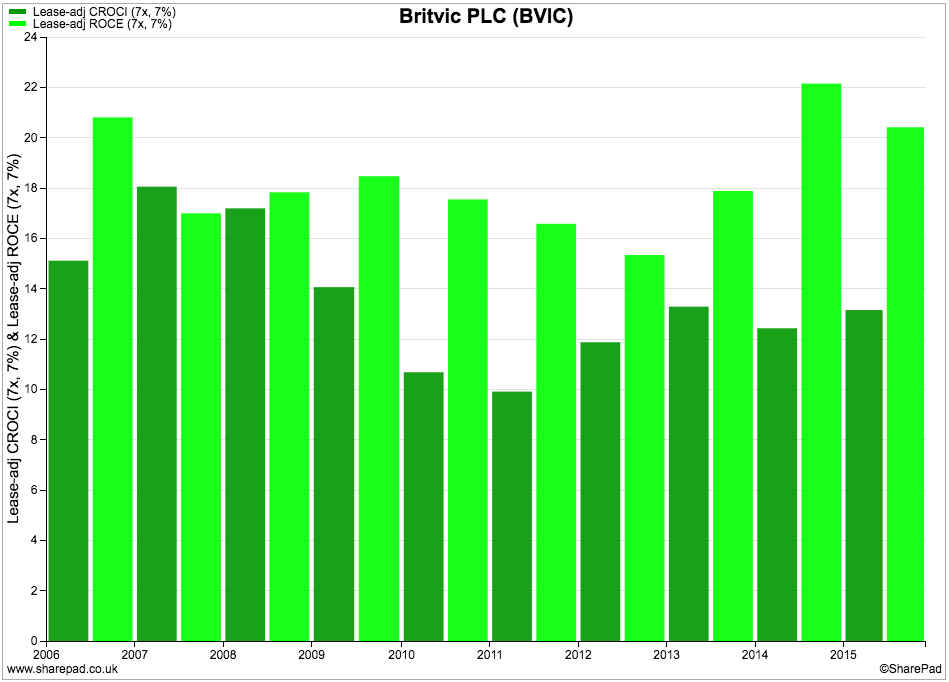
Britvic meets this quality threshold as ROCE - shown by the lighter bars in the chart below - was over 20% in 2015 and has been over 15% for most of the last decade.
The darker bars on the chart below show the free cash flow return on capital invested or CROCI for short. We will look at Britvic's free cash flow in a minute, but the company's CROCI performance has been good and has been regularly over 10% - my benchmark for identifying quality businesses.
CROCI is usually lower than ROCE for two reasons. Firstly, CROCI is stated after tax. Secondly, CROCI - being based on free cash flow - is calculated after all spending on new assets (capex) which is often more than the depreciation used in the calculation of profits (and ROCE).
Free cash flow performance
Good businesses turn a high percentage of their profits into free cash flow. In terms of the chart below, you are looking for the lighter bars which represent free cash flow per share to be as close as possible to the darker bars which represent earnings per share (EPS).
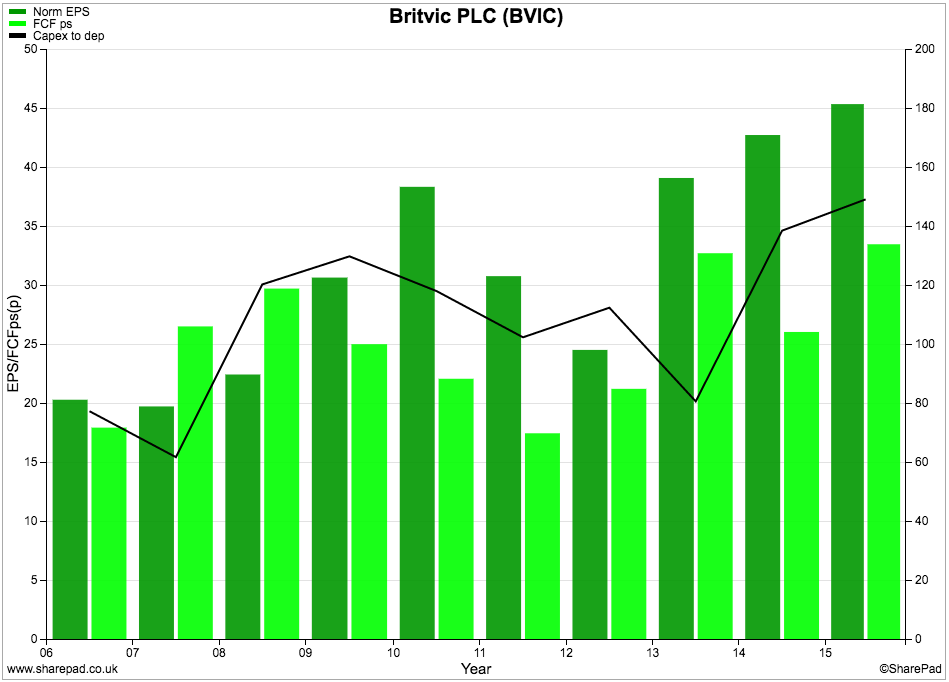
Britvic is doing reasonably well on this measure.
One of the major reasons for free cash flow per share to be less than EPS is when capex is more than depreciation - i.e. the capex to depreciation ratio is more than 100%. You can see that Britvic's capex has been increasing in recent years.
Spending money on new assets can help a company grow its profits in the future but it reduces cash flow in the short-term. Lower free cash flow isn't always a cause of concern as long as ROCE is holding up or improving. This is what has been happening at Britivic which is a good sign.
Dividend growth
Companies do not have to pay a dividend to shareholders. There are good companies out there that pay very small or no dividends as they want to reinvest their profits to grow faster.
However, for dividend-paying companies, a track record of dividend growth can be a sign of company health as long as it is not borrowing money to do so.
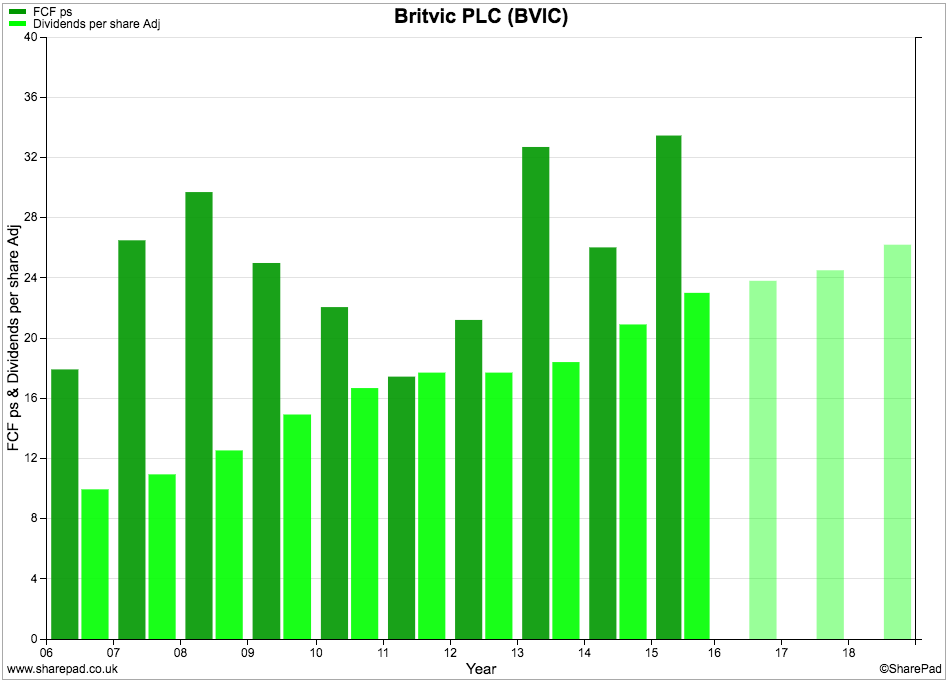
The lighter bars show that Britvic's dividend has been growing and is expected by City analysts to keep growing. The dark bars in the chart above are bigger than the lighter bars which shows that Britvic has produced enough free cash flow to pay its dividends - another good sign.
Are Britvic's finances in good shape?
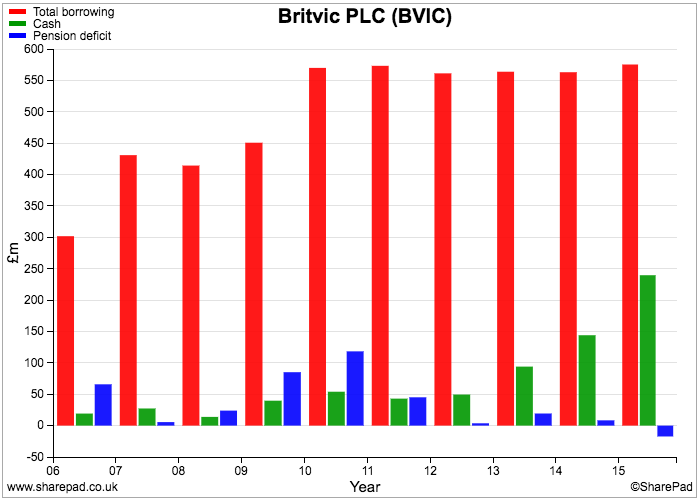
They seem to be. Borrowing levels are stable, cash balances have been rising and the pension deficit moved to a surplus in 2015.
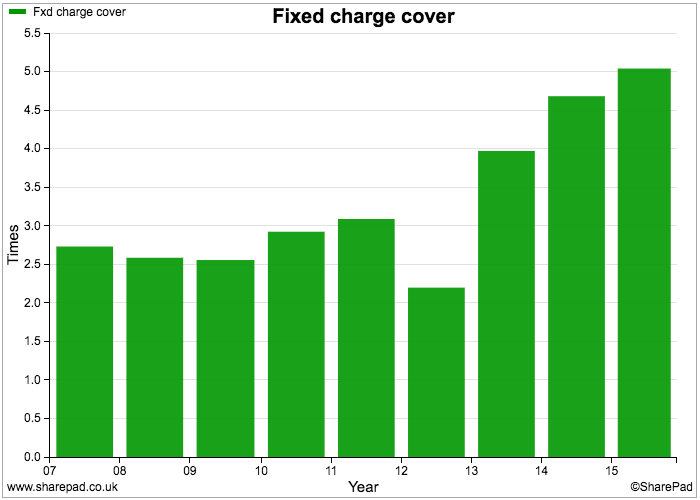
Fixed charge cover - which looks at how many times a company's trading profits can pay the interest on borrowing and the rent bills on leased assets - is over five times which is very comfortable.
So based on its recent history, Britvic looks to be a very reasonable business with a reasonable financial position.
So what are investors worried about?
Well it seems there are grounds to worry about the outlook for Britvic's profit margins.
The problem facing Britvic and its peers is that the UK soft drinks market is fiercely competitive and has been under a cloud for some time.
Consumer preferences have also been slowly changing. They have been moving away from sugary drinks whilst even low or zero-sugar varieties are hardly seen as being healthy compared with water and some juice drinks.
Competition is intense. You only have to walk around a supermarket or convenience store to see that there are lots of soft drinks being sold at promotional prices as companies try and gain market share. The level of competition has been so tough that overall prices have been falling which is not helpful if you are not selling more bottles of drink.
Britvic's third quarter trading statement showed that its selling prices had continued to fall. However, the fall in the value of the pound has pushed up the costs of the raw materials that Britvic uses to make its soft drinks. It seems fair to ask, how can it recover those increased costs if prices are falling? If it cannot pass on these increased costs then there is scope for profit margins to fall.
Looking further out, there is the UK government's proposed sugar levy on fizzy drinks which is due to come into effect in April 2018. Investors are worried that this will hold back the sales and profits of the drinks companies. Whether it will or won't remains to be seen, but the uncertainty has not been helpful to the share prices of the quoted companies.
Profit forecasts and valuation
I've created the following table in SharePad so I can easily analyse the trends in turnover, profits and dividends:

Forecasts by City analysts are always best taken with a pinch of salt. That said, they are not expecting Britvic's profits or profit margins to collapse - although margins are expected to fall slightly. The company said back in July that it remained on track to produce trading profits (EBIT) for 2016 of between £180m and £190m.

However, the shares trade at a big discount to its sector peers on just over 12 times forecast earnings and a well-covered dividend yield of over 4.2%. This discount is nothing new but then there are far worse businesses than Britvic out there trading on much higher valuations.
Based on current 2015 EBIT staying the same forever, Britvic's earnings power value (EPV) explains nearly 90% of its current enterprise value - in other words not much future profits growth is being priced into the shares.
Could Britvic become a takeover target? Soft drinks companies who are finding it hard to grow could get together and cut costs in order to keep their shareholders happy. Back in 2012, AG Barr tried to get together with its rival Britvic but the deal fell through. Could the deal be resurrected or might another company try and buy Britvic instead? Pepsico has held a 5% stake in Britvic for years but has never shown an interest in buying it.
Or perhaps, the stock market is right and soft drinks companies will struggle to grow in the future.
I'll leave it up to you to do some more digging and work out for yourself what the future might hold.
Why is it important to use lease-adjusted measurements of company returns?
Leasing assets rather than owning them shifts debt off a company's balance sheet. This reduces the value of capital employed (debt and equity) which is the denominator in the ROCE and CROCI calculations. Thus hidden debts improve a company's ROCE and CROCI. Look at the chart below which shows unadjusted and lease-adjusted ROCE values for Computacenter.
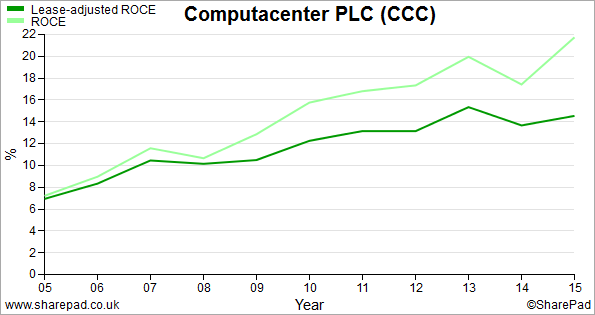
You can see that by leasing more of its assets, Computacenter has achieved unadjusted returns of over 15% since 2010. Lease-adjusted returns have exceeded 15% only once - in 2013.
If you have found this article of interest, please feel free to share it with your friends and colleagues:
We welcome suggestions for future articles - please email me at analysis@sharescope.co.uk. You can also follow me on Twitter @PhilJOakley. If you'd like to know when a new article or chapter for the Step-by-Step Guide is published, send us your email address using the form at the top of the page. You don't need to be a subscriber.
This article is for educational purposes only. It is not a recommendation to buy or sell shares or other investments. Do your own research before buying or selling any investment or seek professional financial advice.