Analysing the stocks in a filter
Running filters or screens is a popular way of finding shares to invest in. Whilst screening can be very powerful it is important to recognise that blindly buying shares which meet a set of financial criteria is rarely a route to success. Good investors use screening as a way of concentrating their research efforts.
SharePad provides you the private investor with a comprehensive set of filtering tools. You can make them as simple or as complicated as you want. In order to give even more help in weighing up a company, SharePad's financial summary view allows you to get a very good snapshot of each business in a matter of minutes.
Let's take a look at a reasonably simple filter and see how you can use it with the financial carousel and other SharePad tools to create a list of shares to research.
Phil Oakley's debut book - out now!

Phil shares his investment approach in his new book How to Pick Quality Shares. If you've enjoyed his weekly articles, newsletters and Step-by-Step Guide to Stock Analysis, this book is for you.
Share this article with your friends and colleagues:
Filtering for shares with a reasonable dividend yield and dividend growth
Below is a filter of the FTSE All-Share index looking for shares with the following characteristics:
- A current dividend yield of at least 3%.
- Forecast dividend growth of at least 10%
- Forecast dividend cover of at least 1.5 times.
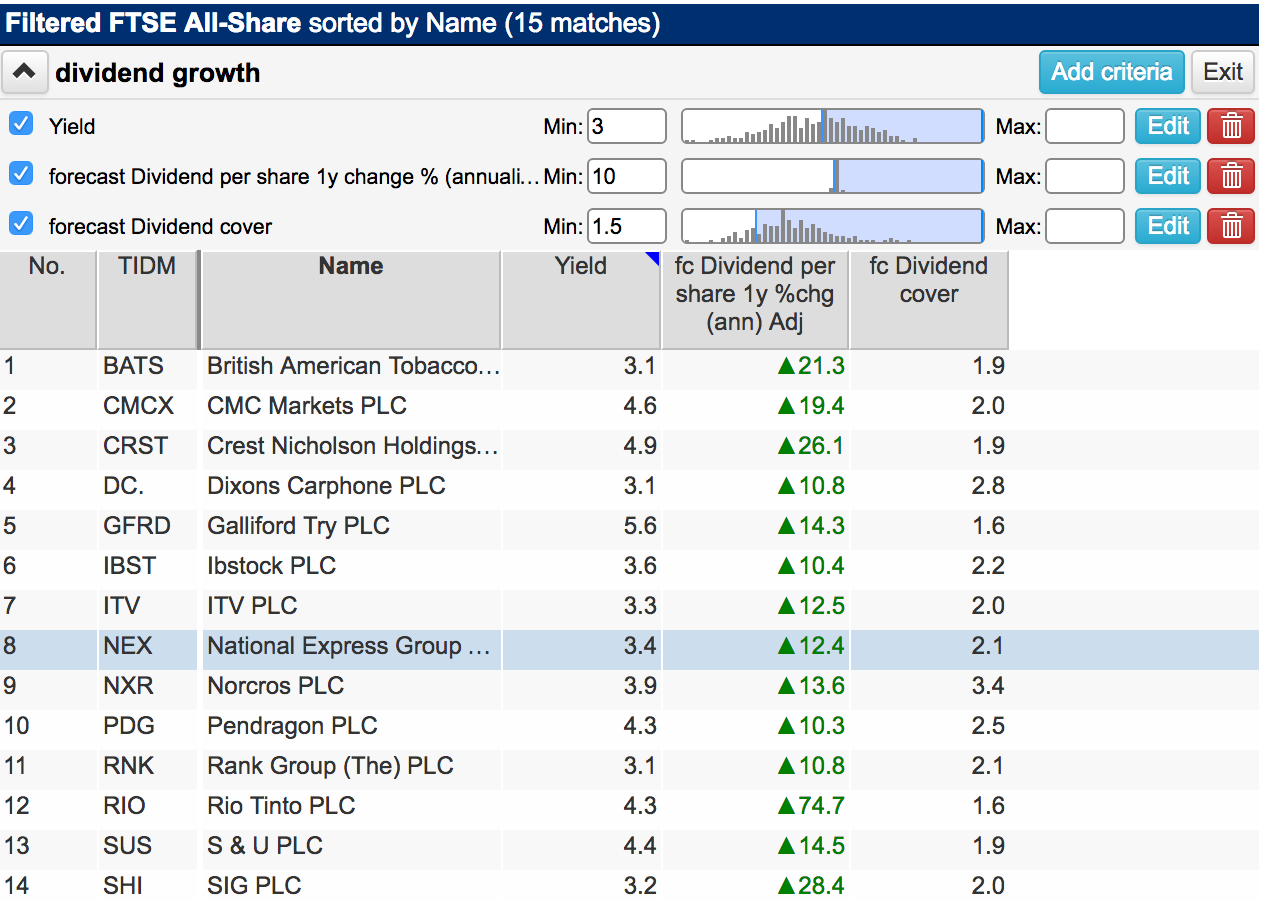
This is the kind of filter an income investor might run when looking for reliable dividend paying shares - shares with a decent starting yield where dividends are expected to grow and are reasonably covered by profits.
SharePad has found 15 shares which meet the filtering criteria. Let's take a closer look at National Express (LSE:NEX) using SharePad's financial carousel.
The financial carousel
You will find the financial carousel on the Summary tab of the Financial view. If you have a small screen, scroll down past the dashboard and you will come to it (or make the Financial view full screen).
The carousel is a series of charts which are designed to help you learn a lot about a company in a very short period of time. Underneath each chart is an explanation of the featured measure(s). We have split the charts into four key sections:
- Key data
- Quality
- Safety
- Valuation
Dividend history and forecasts
Whilst looking at National Express, we are going to look at information which relates to its ability to continue paying - and hopefully growing - its dividends to shareholders.
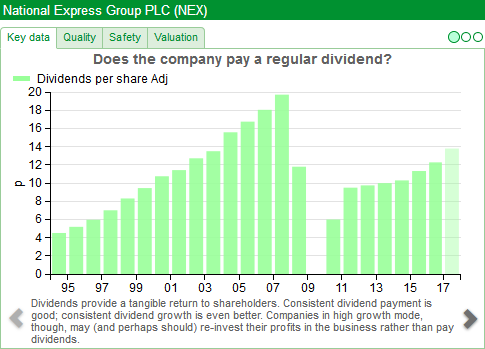
The chart above shows the company's dividend history. We can see that the company has a good record of growing its dividends up until 2007. The dividend was cut in 2008 and not paid at all in 2009.
This is a sign of a company that was in serious difficulties at the time and should be a major focus point for any further research. You want to try and find out if the dividend was cut and suspended due to general economic or business cycle issues - in which case it might happen again - or if it was due to a company specific issue which has now been addressed.
We can see that dividends were resumed in 2010 and have been growing every year since then. The lighter green bar at the end relates to forecast dividends per share from City analysts. This is telling us that dividends are expected to keep on growing - a welcome sign.
Is it a decent business?
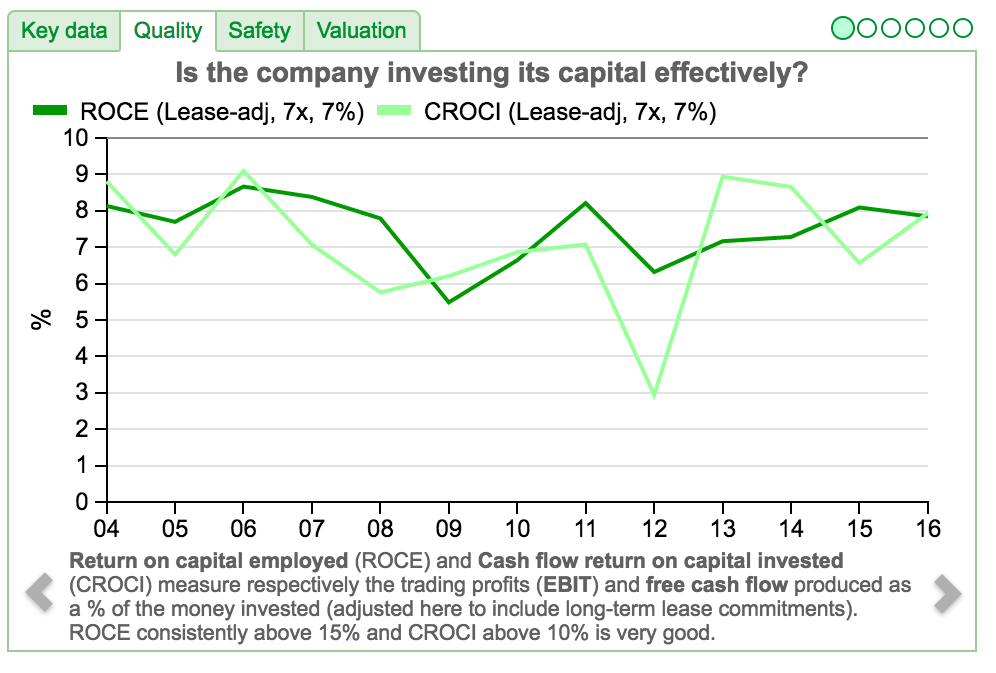
Based on its ROCE and CROCI figures, National Express does not seem to be an extremely profitable business. Its returns on investment are very modest (below 10%). This can be explained by the nature of its business. Running buses is very asset intensive and profits can be restrained by regulation and or competition.
Low returns could also be due to the company making lots of acquisitions and perhaps paying too much for them - another thing to look into.
What we can see is that ROCE has been reasonably consistent in recent years. As an investor looking at a company's dividend paying ability that can be a reassuring trend.
Does the company have too much debt?
Interest on debts has to be paid before shareholders get paid a dividend. A company with too much debt can struggle to pay the interest on it if profits fall - and this can put a dividend at risk of being cut.
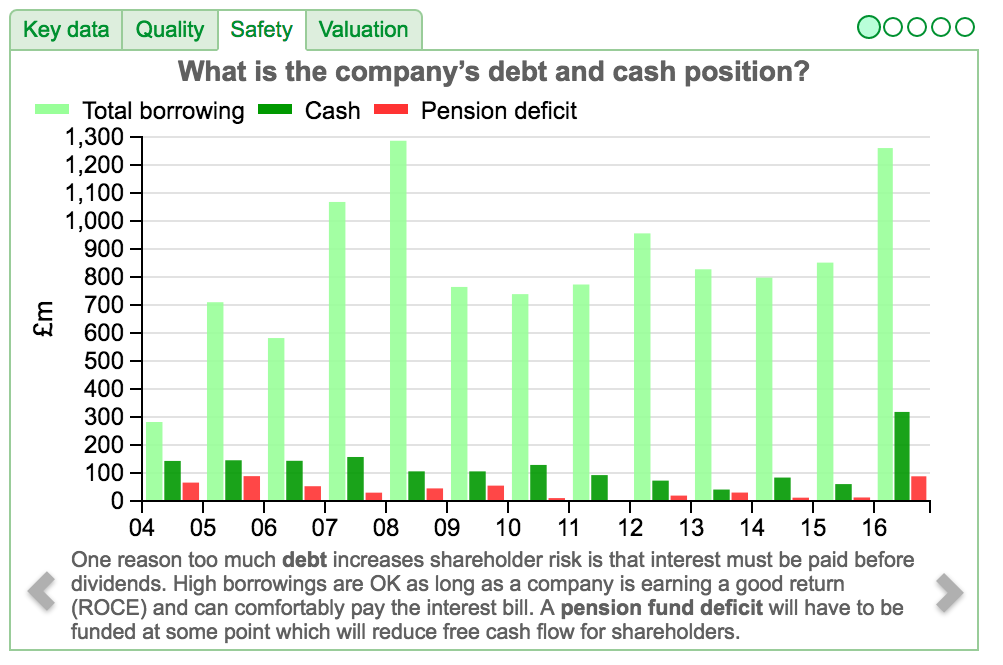
In the Safety section of the carousel, I can see that National Express does have a lot of debt. Borrowing increased last year but so too did cash balances. There is a pension deficit as well which is another obligation that has to be met before dividends are paid. A big pension fund deficit can be a major headache for shareholders.
Click along the charts in the safety section and you will come to the fixed charge cover ratio. This looks at how comfortably a company's profits can pay the interest on its debts and the rents on off balance sheet assets.
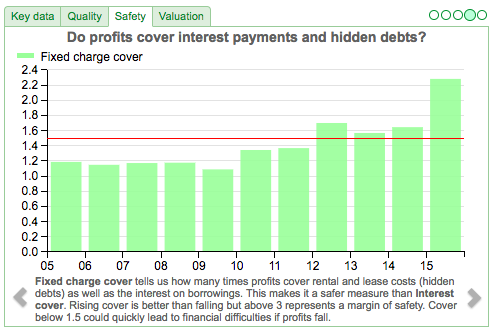
We can see here that there has been a significant improvement in National Express' financial position in 2016 which is another welcome sign.
Is the dividend being paid from free cash flow?
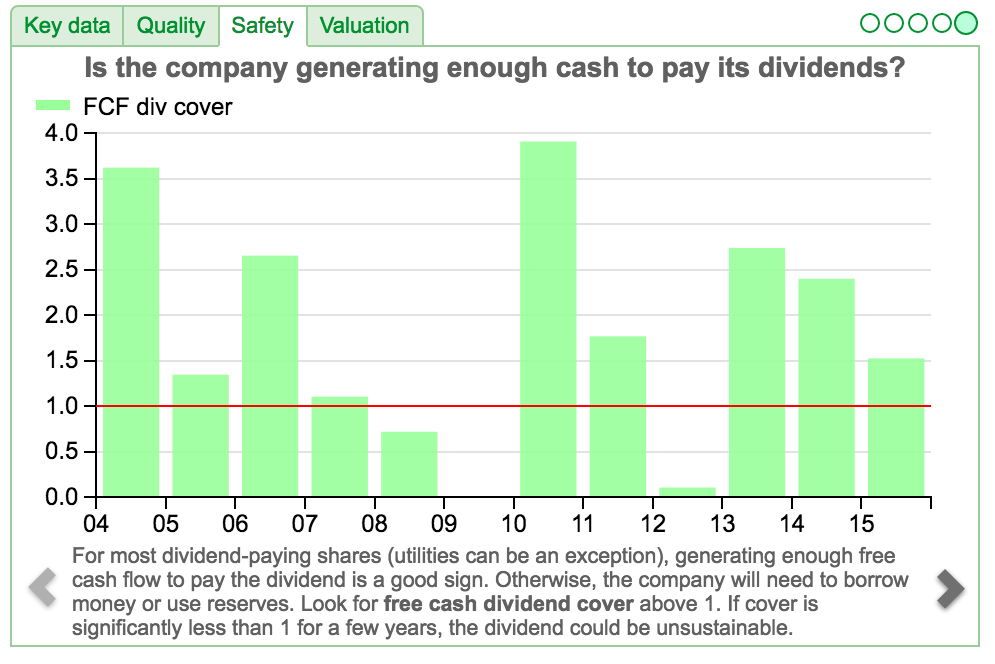
For the last three years, National Express has paid a rising dividend out of its surplus or free cash flow. This is usually a good sign for shareholders as long at the free cash flow is not being created at the expense of keeping a company's assets in good condition (i.e. capital expenditure is consistently less than depreciation).
The level of free cash dividend cover has been coming down. This is something you would want to look into to see if it is something to worry about. I'll answer this question shortly.
What is the company saying about its dividend policy?
SharePad has a detailed news function. It contains RNS and Dow Jones' news stories going back several years. This means that you can read a company's financial releases and major news stories without having to leave SharePad and trawl the internet.
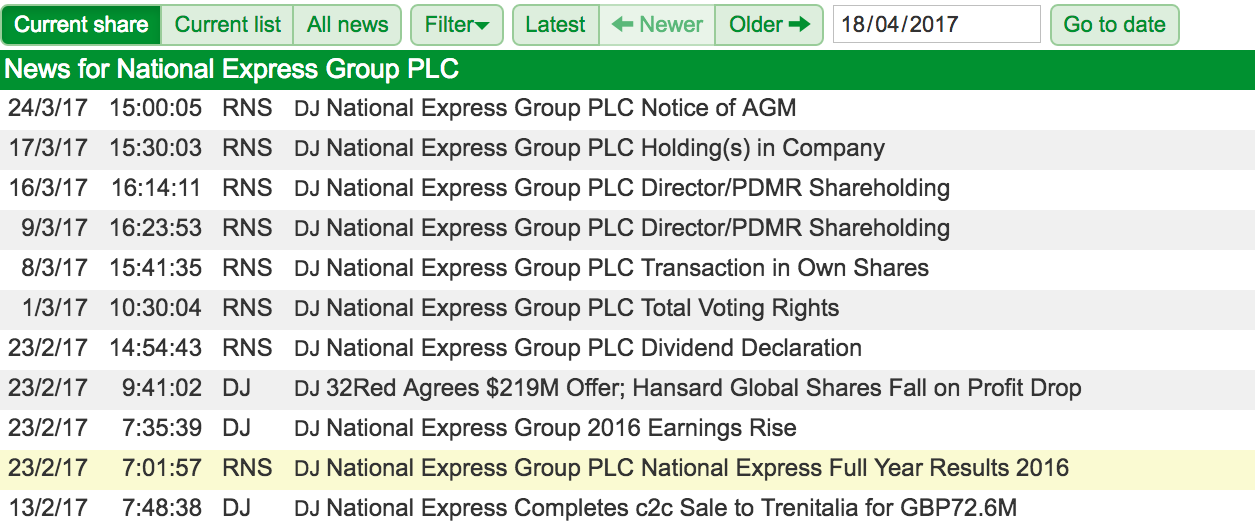
Here we can see that National Express released its 2016 results on 23rd March 2017. It made the following comments about its dividend:

"...means we are both raising our annual free cash flow guidance to GBP120 million and we propose a 10% increase in the final dividend."
"The second half of 2016 saw a significant weakening of Sterling against world currencies with markets forecasting a broad range of future movements. In light of this volatility, our long-term dividend policy remains to pay a dividend covered two times by Group earnings. We propose a 10% increase in the final dividend giving an 8.4% increase in the full year dividend to 12.28 pence, which is 2.2 times covered."
The possible concerns about free cash flow to pay rising dividends has been met with an improved free cash flow guidance for 2017.
What income return might you receive from the shares?
We already know from the filter that National Express has a trailing yield based on its current annual dividend per share of over 3%. The chart below gives you an indication of what yield you might receive if you buy the shares at the current share price of 360p.
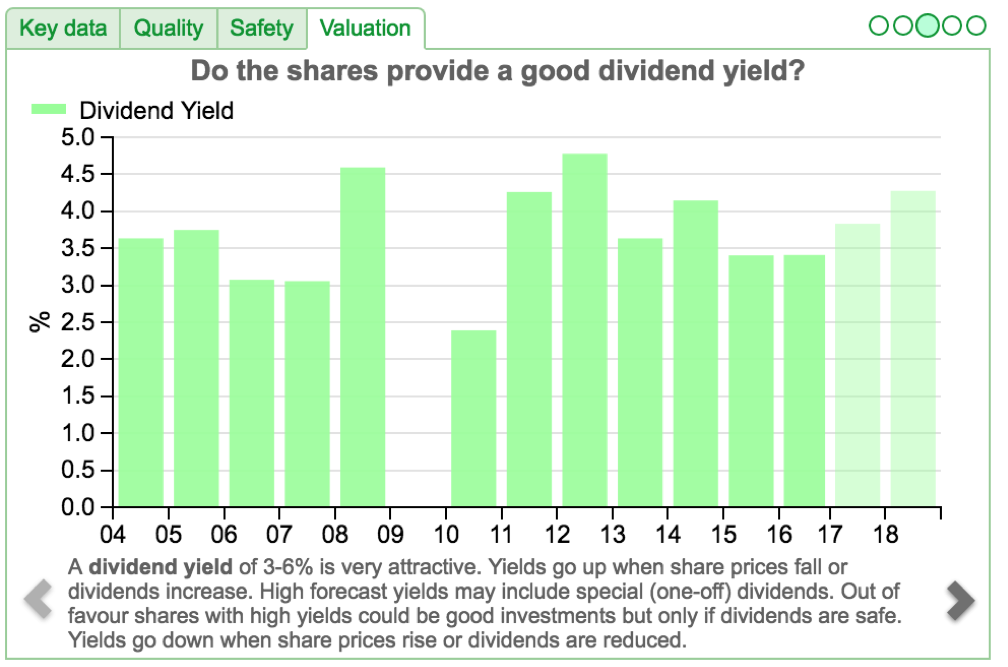
We can see that dividends are expected to increase giving a rising income return or yield on a purchase price of 360p. You can also see the historic yield of the shares to see how the stock market has valued the company's dividend stream in the past. This can help give you an insight into whether the shares are cheap, expensive or reasonably valued.
National Express may be a share which warrants further consideration for income investors. Hopefully you can see how SharePad's financial carousel can help you disregard shares or earmark them for further investigation in a matter of minutes.
We've recently added a wide range of filters to SharePad's Filter Library. To access the library, click on Filter on the List view menu and select Add filter. In the Add filter dialog you will see the Library button. You can read an article about the new filters here.
If you have found this article of interest, please feel free to share it with your friends and colleagues:
We welcome suggestions for future articles - please email me at analysis@sharescope.co.uk. You can also follow me on Twitter @PhilJOakley. If you'd like to know when a new article or chapter for the Step-by-Step Guide is published, send us your email address using the form at the top of the page. You don't need to be a subscriber.
This article is for educational purposes only. It is not a recommendation to buy or sell shares or other investments. Do your own research before buying or selling any investment or seek professional financial advice.