PE ratios and how to use them
Price to earnings (PE) ratios are the most commonly used method of weighing up the value of a company and its shares. They are calculated using the following simple formula:
PE ratio = Share price/Earnings per share (EPS)
PEs are popular with investors because of their perceived simplicity - share prices are readily available - and for the acknowledged fact that a company's profits or earnings are a key driver of share price.
But in reality PEs are anything but simple. The PE ratio can take a number of different forms. If you are going to use them as part of your investing toolkit then it is useful to try and understand them a bit more.
In this article, I am going to look at some of the major issues investors face when using PE ratios and how you can take them into account.
Phil Oakley's debut book - out now!
Phil shares his investment approach in his new book How to Pick Quality Shares. If you've enjoyed his weekly articles, newsletters and Step-by-Step Guide to Stock Analysis, this book is for you.
Share this article with your friends and colleagues:
General problems with PE ratios
Apart from the question as to whether EPS is a good measure of company performance (I don't think it is), the most obvious flaw is that PEs cannot be used when EPS is zero or negative. There are also issues with the fact that EPS can be subject to manipulation via the aggressive use of accruals (or matching) accounting. Then there is the fact that PEs are distorted by the use of gearing or leverage and large cash balances. More on this last point later on.
Which EPS number to use
Investors are literally bombarded with different EPS numbers:
- Basic or reported EPS - which show the profits and losses from trading activities as well as one-off gains, losses and expenses.
- Underlying EPS - the profits coming from the continuing operations of a company (i.e. profits/losses from discontinued operations are excluded). In ShareScope and SharePAd we call this "normalised" EPS but it can also be called adjusted or core EPS.
- Diluted EPS - a measure which takes into account the extra shares that could take a share of profits from share options, warrants and convertible securities.
- Trailing twelve month EPS - the profits from the last twelve month's trading performance (using the latest quarterly or interim numbers).
- Forecast EPS - the forecast profits of a company. In most cases, these forecasts are for underlying (normalised) EPS.
Generally speaking, most investors will focus on the normalised profits of a company and take into account the diluted number of shares in issue. So they will look at PEs based on diluted normalised EPS. All PE ratios in SharePad and ShareScope are based on diluted EPS numbers.
This is the same EPS that companies tend to talk about in their communications with investors. You need to be wary of this number. Some companies can develop a habit of saying some costs are one-off or exceptional when they are not in order to make their underlying EPS look better.
You should always compare reported EPS with normalised EPS for a number of years. If there are big differences between the two numbers over a period of time you need to try and find out why this is happening. It can be a sign of aggressive accounting if normalised EPS is much higher than basic EPS. Staying away from these kind of companies is a good way of protecting your portfolio from nasty surprises.
The different types of PE ratio
I am now going to briefly discuss the following forms of the PE ratio:
Trailing or current PE
This is based on the last annual normalised EPS figure for a company. The main reason for using this version is that the EPS figure is already known. There is no uncertainty caused by doubts as to whether forecasts are realistic or not.
The key drawback with using a trailing PE is that the company in the future may be different from its past. For example, it may have undertaken a company-transforming acquisition or taken on lots of debt. It may also be growing its profits very quickly which could mean that its last annual EPS is not a good figure to value the shares on.
Trailing Twelve Month (TTM) PE
This PE is based on a rolling twelve months EPS for a company. It gives a more up to date valuation than a trailing PE. It is particularly useful for appraising the value of companies which have reported half year or quarterly profits. If the company has not reported any profits since its last year end then the TTM PE will be the same as the trailing PE.
Forecast PE
Many investors and analysts prefer to use a forecast or forward PE to weigh up the valuation of a company. This makes a great deal of sense as the valuation of a company is based on its future profits, not the profits it has made in the past. However, they are only really useful if the forecasts they are based on are realistic. If they are not, and forecasts have to be reduced then a forecast PE loses some of its value.
Generally speaking, forecast EPS has taken a considered view of the company's prospects for the year ahead. If profits are growing quickly then the forecast PE number will be considerably lower than the trailing PE. If profits are shrinking then the trailing PE number will be lower than the forecast PE.
One important point to consider about the forward PE is that it is only based on one year's forecast EPS. You need to think about the long-term direction of a company's profits when you are investing in its shares.
Debt-adjusted PE
PEs are distorted by how a company is financed - its capital structure. Companies with large cash balances can look more expensive (have a higher PE) because the value of the cash is reflected in the share price (the market value or capitalisation of the company). However, the cash produces little in the way of earnings, especially in these days of ultra-low interest rates.
The effect of debt on the PE ratio is more complex. When a company borrows money to buy back shares this can lower a PE ratio. Here's why:
- The increase in debt reduces the company's market capitalisation and the number of shares shrinks.
- The company's profits are reduced by a smaller proportional amount (the interest on the extra debt).
The net effect is that EPS often increases as a result of a debt-financed buyback which shrinks the PE ratio (making the stock look cheaper).
Sometimes an increase in debt can be a good thing. This happens when a company borrows money to invest in lucrative, value-creating projects which increase profits. In this case, debt can cause the PE to increase.
Debt, including any pension deficits, does increase the risks faced by shareholders. Interest on borrowings and top-up payments to plug pension fund shortfalls have a prior claim on a company's profits. The bigger these claims, the more vulnerable shareholders' profits (EPS) are to a fall in a company's trading profits. This risk is reflected in a lower PE ratio for the shares compared with an identical company with no debt.
SharePad calculates debt-adjusted PEs by taking the company's enterprise value (essentially the sum of its market capitalisation, net debt and pension fund deficit) and dividing it by its EBIT (often referred to as trading or operating profit). Debt-adjusted PEs can only be calculated on a trailing basis.
In the table below you can see some highly-indebted companies - where the value of debt is more than the market value of equity - and the differences between the trailing PE and debt-adjusted PE.
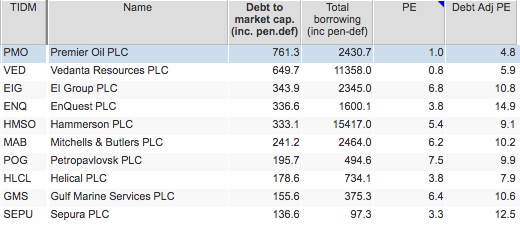
You can see how debt depresses the normal PE numbers. If you think that a low PE might be a sign of a really cheap share then check to see how much debt it has. You might be mistaken.
How to use PE ratios
The simple interpretation of a PE ratio is that the lower the number, the cheaper the shares. This is not always the case as the discussion on debt above shows.
One of the best ways to use PEs is when you are comparing the valuation of shares in a particular sector. When you are comparing the value of similar companies always use the same version of the PE ratio so that your comparisons are meaningful.
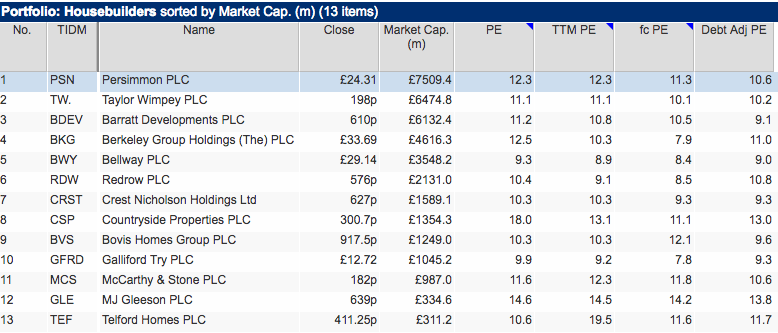
The UK housebuilding sector and its various PE ratios are shown in the table below.
There is a neat tool in SharePad which enables you to compare a company's PE with the sector average.
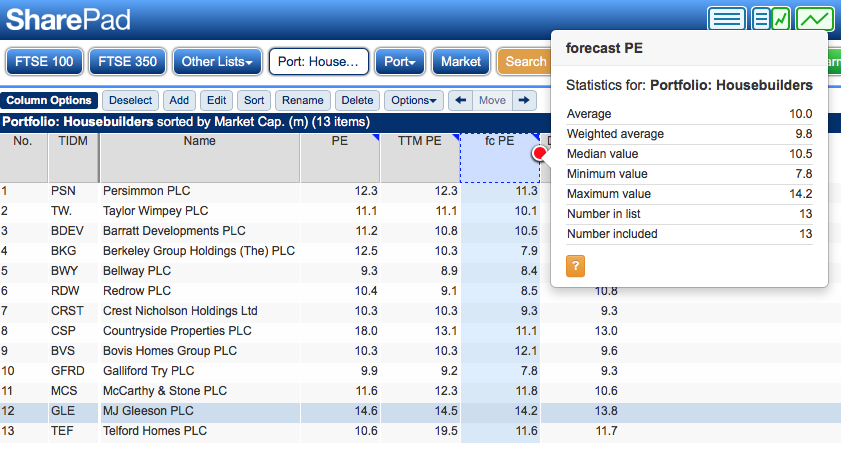
SharePad Users: To display these statistics, click on a column heading; a new button - Options - will appear on the List view menu bar. Click on this button and select Column statistics. The statistics will be displayed. This is best done in a filtered list or portfolio.
In isolation, these PE numbers don't tell us a great deal about how attractive or otherwise a company's shares might be. For example, are Persimmon shares on a forecast PE of 11.3 more expensive and less attractive than Berkeley Group on a forecast PE of 7.9? Are Berkeley shares a bargain because its forecast PE is a substantial discount to the sector average?
They might be, but to get a more meaningful interpretation of a PE ratio you need to try and understand how PEs are determined in the first place.
Essentially, a company's PE is determined by three key things:
- The quality of the business. A good indication of this is the return on capital employed (ROCE) it produces. As a rough rule of thumb, the higher the ROCE, the higher the quality of the business.
- How risky the business is? For example, do profits move up and down a lot? Are profit margins low? Does the company have a lot of debt? The higher the risk, the lower the PE ratio should be.
- The company's growth prospects. Strong profits growth should have a higher PE attached to it than low profits growth.
These three things essentially some up the holy grail of investing - trying to find high quality companies which can achieve grow for a reasonable price.
You can quickly weigh up a company's quality, growth and risk characteristics by setting up a table in SharePad as I have below.
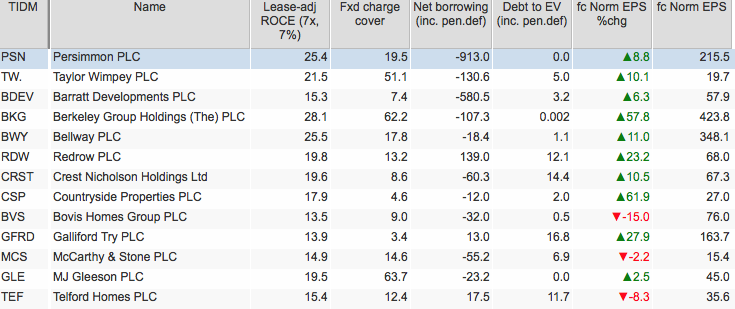
As you can see, many housebuilders currently have high returns on capital, low or no debt, substantial cash balances and decent rates of expected EPS growth. Berkeley Group does look very attractive against this backdrop.
So why are the PE numbers comparatively low? Many companies with less impressive financial characteristics and lower short-term EPS growth trade on PE ratios of 20 or more at the moment. What's going on here?
PE ratios and cyclical companies
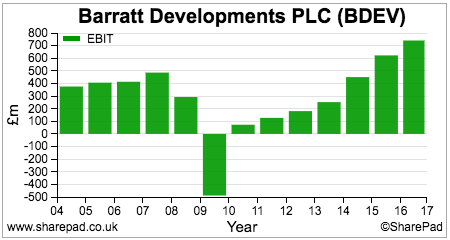
The explanation rests with the cyclical nature of housebuilding companies' earnings. Profits are high when the economy is doing well but tend to fall sharply when the economy is doing badly. Barratt Developments profits history shows this quite clearly.
When profits are high, investors often think that they are close to the top of the profit cycle and that they will start to fall eventually. This means that the share price doesn't go up much when EPS is rising and the PE is quite low.
Conversely, when profits are low and depressed, investors often expect them to eventually recover and the PE ratio can be high.
What this can actually mean for investors in cyclical companies is that sometimes it is often the best to buy them when the PE is high and the best time to sell is when the PE is low. This is the opposite approach that people tend to take with non-cyclical shares.
So how do you value a company with cyclical earnings using a PE ratio?
One approach is to use something called the cyclically-adjusted PE ratio (CAPE). This takes the current share price and divides it by the average EPS for the last 10 years adjusted for inflation. This can smooth out the ups and downs of an economic cycle. SharePad does this calculation for you and you can add it as a column to a table of shares.
Advanced analysis
Another method for working out a cyclically-adjusted valuation is to take the average return on equity (ROE) over the last 10 years (a housebuilding profit cycle) and multiply this by the current NAV per share. I have done this in SharePad by using the Combined items feature and then tidied it up a bit by exporting to a spreadsheet. The estimated EPS figures have been divided by 100 to express them in pence.
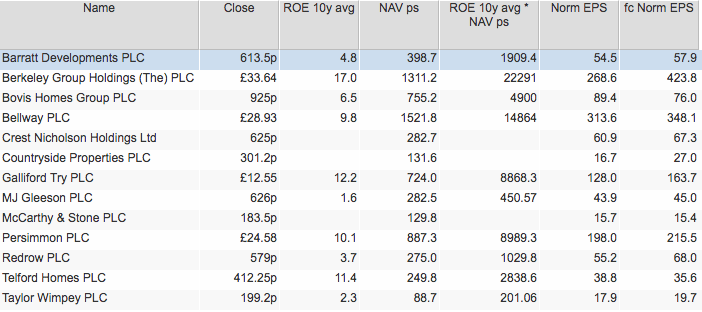
| Name | Close (p) | EPS (p) | PE |
|---|---|---|---|
| Barratt Developments PLC | 613.5 | 19.1 | 32.1 |
| Berkeley Group Holdings (The) PLC | 3,364.00 | 222.9 | 15.1 |
| Bovis Homes Group PLC | 925 | 49 | 18.9 |
| Bellway PLC | 2,893.00 | 148.6 | 19.5 |
| Galliford Try PLC | 1,255.00 | 88.7 | 14.2 |
| MJ Gleeson PLC | 626 | 4.5 | 138.9 |
| Persimmon PLC | 2,458.00 | 89.9 | 27.3 |
| Redrow PLC | 579 | 10.3 | 56.2 |
| Telford Homes PLC | 412.25 | 28.4 | 14.5 |
| Taylor Wimpey PLC | 199.2 | 2 | 99.1 |
This kind of analysis can give some strange numbers, particularly for companies that have experienced big losses in the past which can make their interpretation and usefulness a bit questionable.
The main problem with this is that it assumes that past average cyclical ROEs are indicative of what a company might earn in the future. They might be, they might not. Take them with a pinch of salt but they might on occasions prove to be useful and help you put current valuations into perspective.
Berkeley, Galliford Try and Telford Homes have the lowest PE numbers using this approach. I'll leave you to ponder on what that might mean.
If you have found this article of interest, please feel free to share it with your friends and colleagues:
We welcome suggestions for future articles - please email me at analysis@sharescope.co.uk. You can also follow me on Twitter @PhilJOakley. If you'd like to know when a new article or chapter for the Step-by-Step Guide is published, send us your email address using the form at the top of the page. You don't need to be a subscriber.
This article is for educational purposes only. It is not a recommendation to buy or sell shares or other investments. Do your own research before buying or selling any investment or seek professional financial advice.