Hunting in the minefield of cheap shares
Most people like a bargain. Bargain hunting on the stock market has long been a popular pastime or even a full time occupation for investors. There's no shortage of books, articles and advice that tell investors to pursue a 'cheap is best' strategy if they want to get rich.
Yet in most cases there is a world of difference between cheapness and good value.
With most things in life I am a firm believer in quality over price. Whether I am buying shares in a company, a new washing machine or a car I strongly believe that you get what you pay for. Cheap stuff is often of inferior quality that lets you down, whilst high quality stuff has a tendency to last and bring satisfaction for many years.
However, every now and again the stock market does offer up a proverbial dollar for fifty cents. But how do you know when you have an unbelievable bargain staring you in the face?
There are lots of different ways to find cheap shares and it's not difficult. One popular approach is to screen for them on the basis of low valuations such as low price to earnings (PE) ratios, high dividend yields and low price to book values (P/NAV). That said, I find that the best opportunities usually come from a company that you know and understand well - perhaps because you've owned shares in it before - and realise when the market might just be putting the wrong price on it.
So finding cheap-looking shares is the easy bit. Working out whether they are good value or a piece of junk is a little bit trickier.
None of us can predict the long-term future with any great accuracy. However, if you want to get some kind of feel about where a company's fortunes might be heading then studying its past financial performance is always useful in my opinion. The way I look at it is that if you want to understand where you might be going it's usually helpful to know where you've come from.
Phil Oakley's debut book - out now!
Phil shares his investment approach in his new book How to Pick Quality Shares. If you've enjoyed his weekly articles, newsletters and Step-by-Step Guide to Stock Analysis, this book is for you.
Share this article with your friends and colleagues:
A selection of shares that look cheap
Below are a selection of half a dozen shares that might be considered to have cheap valuations. All the shares have a forecast PE ratio which is less than the forecast dividend yield which is a rough and ready indicator that they are trading at distressed levels.
Now to try and quickly work out whether these shares are cheap because they deserve to be or if they might just be good value at current share prices. I am going to do this by looking at a number of key ratios to help me learn a lot more about each company.
This is a very useful exercise for narrowing down your list of candidates for further research. It also helps you to sift through a number of shares quickly. It should not be seen as a shortcut to a thorough and detailed analysis of a business.
What I am doing here is simply using numbers (ratios) to give me some help in answering some key questions about a company. I'll do this by listing the questions and the ratios I am using to help me answer them.
Is it a reasonable or good business?
Return on capital employed (ROCE)
ROCE is my go-to ratio for answering this question. It tells me how much a company is getting back in trading profits as a percentage of the amount of money it has invested in its businesses. I always adjust ROCE to take into account rented assets which is a common feature of businesses such as retailers (mostly shops) or airlines (planes).
A very good business will consistently produce ROCE of more than 15% year in year out. A reasonable business will have a ROCE of more than 10%. Mediocre or poor businesses will have ROCE of less than 10%. I might make an exception to this last rule if I was looking at a regulated business such as a water or electricity network company.
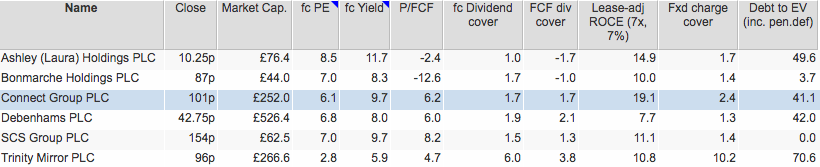
Debenhams fails this test but the others pass the reasonable business test based on their most recent reported annual financial results. Connect Group passes my good business criteria on ROCE whilst Laura Ashley comes close.
This would make me take a closer look at the trend in ROCE. Is it rising, falling or staying the same?
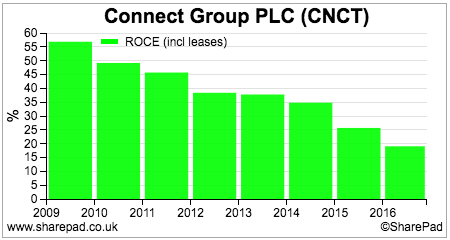
Connect's ROCE has been falling sharply in recent years. Without knowing anything else, this trend with worry me. Is this a sign of a company where profits are falling off a cliff or will ROCE stabilise?
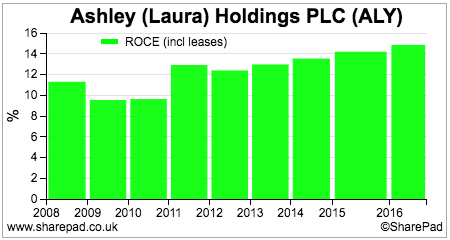
Laura Ashley's ROCE seems to have been getting better. I would definitely take a closer look at this company to try and find out why. Are profits improving due to growth in sales or has it been shedding unprofitable lines of business?
Does the company have too much debt?
Debt to EV & Fixed charge cover
Most companies can cope with a little bit of debt, especially if it is used to invest in profitable projects. Too much debt can become a headache for shareholders. But how much is too much?
Well, it depends on the type of business a company is engaged in. For example, utility, tobacco and telecom companies which have reasonably stable and predictable profits and cash flows can cope with reasonably high levels of debt. Cyclical companies or companies with declining profits should ideally have little or no debt.
There are lots of different ways to measure how much debt a company has. One of my favourite measures is Debt to enterprise value (Debt to EV). This measures the amount of debt as a percentage of the market value of the whole company (its market capitalisation plus debt). You should include any final salary pension fund deficit in your calculation of debt as it ranks ahead of shareholders in its claims on company profits and cash flows.
Generally speaking, I like to see Debt to EV of no more than 30%. Anything more than 50% - with the exception of the stable cash flow businesses mentioned above - is starting to look too high with increased risks for shareholders.
SCS and Bonmarche have very low debt levels. The others are quite high, with Trinity Mirror's looking worryingly so due to its massive pension fund deficit.
As well as looking at absolute levels of debt you should also look at the ability of a company's profits to cope with it. This should also include the ability to cope with hidden debts such as rents on property and other assets. This is what the Fixed charge cover ratio does. It takes the profit before rent expenses and divides it by a company's fixed charges - namely interest on debts and rents.
Fixed charge cover below 1.3 times is starting to verge on being uncomfortable, particularly if profits fall in the future. Debenhams is close to this. Connect and Trinity Mirror - despite its high debt levels - look very comfortable on this measure.
However, fixed charge cover is based on trading profits. This means that it does not adequately take into account the costs faced by companies with big pension fund deficits. The cost of the pension fund expensed against profits is typically the benefits earned by members during the year plus any administration expenses. If the company is making substantial top up payments to plug a deficit, the cash paid is shown in the cash flow statement rather than the income statement.
Trinity Mirror is a great example of this. Its final salary pension fund has been closed to further member benefits since 2010. This means that only £2.2m in administration charges was expensed against income in 2016 compared with the £40m of cash paid into the fund.
In this case, Trinity Mirror's operating cash flow - which is stated after the £40m pension top up - is arguably a better measure to base fixed charge cover on. I have done this in the table below by exporting data items from SharePad and doing the calculation in a spreadsheet.
| Name | Operating cash flow | Rental & lease | Interest paid (CF) | OPCF + rent | Fixed charges (rent + interest) | Cash fixed charge cover |
|---|---|---|---|---|---|---|
| Ashley (Laura) | 16.3 | 36.5 | -0.6 | 52.8 | 37.1 | 1.42 |
| Bonmarche | 9.5 | 20.1 | -0.1 | 29.6 | 20.2 | 1.47 |
| Connect Group | 66.7 | 30.4 | -4.9 | 97.1 | 35.3 | 2.75 |
| Debenhams | 240.2 | 441.4 | -15.6 | 681.6 | 457 | 1.49 |
| SCS Group | 13.2 | 26 | -0.2 | 39.2 | 26.2 | 1.5 |
| Trinity Mirror | 91.5 | 9.6 | -18.1 | 101.1 | 27.7 | 3.65 |
Trinity Mirror's fixed charge cover comes down dramatically on a cash basis but still suggests that the company is not in any imminent danger of going bust.
Are dividend payments safe?
Dividend cover & Free cash flow dividend cover
The six companies in the list at the beginning of this article all offer substantial dividend yields that will tempt many investors. Yet buying on the basis of yield alone is often a decision people later regret if the dividend is cut or scrapped entirely.
You can look at the forecast dividend cover which compares forecast EPS with the forecast dividend per share. Here Laura Ashley with its 11.7% forecast yield and forecast dividend cover of 1.0 is standing out. The market clearly believes that its dividend is unsustainable and stands a good chance of being cut.
Trinity Mirror has a very high dividend cover. But remember its EPS figure excludes the big cash payment into its pension fund. The best way to check on dividend sustainability is to look at free cash dividend cover - is there enough surplus cash flow to pay the dividend?
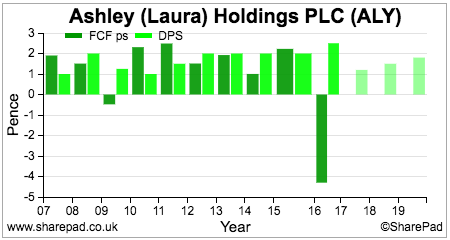
Up until 2016, Laura Ashley's free cash flow per share was capable of paying most of its dividend. We can see the forecast dividend cut expected for 2017 (the lighter shaded bars). But the shares yield 11.7% on that expected lower dividend with dividend increases expected thereafter. Either this expectation is massively wide of the mark or it could be a sign that profits and cash flows will improve and that the shares could be very cheap. The stock market is sceptical given the price attached to the shares.
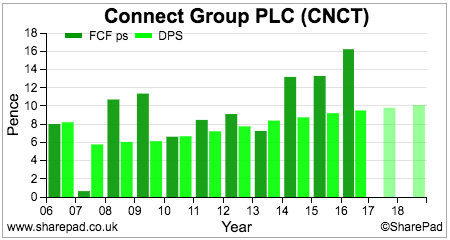
Connect has comfortably paid its dividend from free cash flow in recent years. Yet it shares offer a prospective yield of 9.7% which suggests there are questions about its sustainability. Analysts still expect dividends to keep on growing. The key focus of investors' research should be about answering one key question: Can Connect maintain its levels of free cash flow? If it can, and it can maintain its dividend then its shares could be very cheap.
The importance of margins and cash flow
In most cases, cheap shares are cheap for a good reason. This is usually due to well known weaknesses of its business model and prospects for future profits growth. With the exception of general stock market sell-offs, not many free lunches are given away too often.
So when you come across a cheap share, you need to spend some time working out how robust the company behind them is.
I spend a lot of time looking at profit and cash flow margins - how much of a company's turnover is turned into profits and cash flow. I do not like low margin businesses. They are often a sign of a weak business with limited competitive advantages and pricing power. This makes them riskier businesses for investors as low margins can turn into no margins and losses if there is a downturn in trading. I like to see margins of at least 10%.
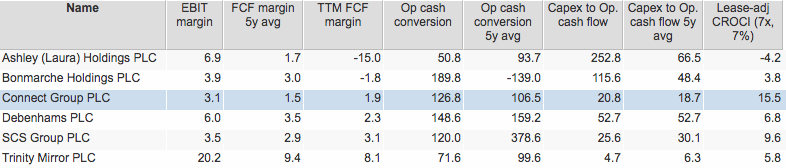
With the exception of Trinity Mirror, the companies above are low profit margin businesses. All of them are low free cash flow margin businesses.
You should be wary of businesses with consistently poor operating cash conversion - the ability to turn operating profits into operating cash flow - as this can be a sign of problems such as pension fund deficits, excessive working capital requirements and sometimes dodgy accounting.
Pay close attention to how much money a company is ploughing back into its business (capex) as a percentage of the cash it has coming in (operating cash flow). High capex ratios (more than 30%) are okay if that capex is earning a high ROCE. If it is not, it can often be a sign of an inefficient business that will ultimately not produce enough free cash flow to keep shareholders happy.
Laura Ashley has both poor operating cash conversion and high capex ratios. Connect and SCS look much better on both these measures.
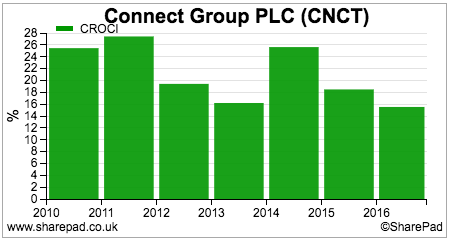
An often overlooked measure of financial performance is the Cash return on capital invested (CROCI). This compares the annual post-tax Free cash flow produced by a business as a percentage of the money it has invested (its Capital employed). A figure of 10% or more is good in my opinion.
Connect stands out on this measure with a very decent 15.5% last year. As you can see from the chart below it has a very decent long-term record on CROCI.

Is there any growth?
One of the major reasons shares can look very cheap is because they have limited ability to grow in the future. It doesn't matter how cheap a share is, if it cannot grow its profits and dividends by a meaningful amount they can and do stay cheap.
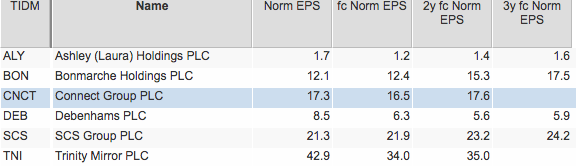
With the exception of Bonmarche and SCS, none of the companies above are expected to deliver any meaningful growth in profits. However, you should also be aware that analyst forecasts should generally be taken with a liberal pinch of salt given that human beings don't tend to be very good at predicting the future.
Not all growth is of the same quality, especially when looking at EPS. Genuine, high quality, real growth comes from selling more stuff because there is sustainable demand for products or services. Growth in EPS which comes from cost cutting, acquisitions or buying back shares is of inferior quality and tends not to last. This should be a major focus of research for all companies not just cheap ones.
Are Connect shares a massive value trap?
Quite possibly, yes.
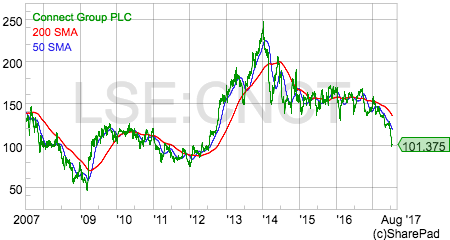
Its share price has tended to be very volatile in recent years and now seems to be in a firm downwards trend.
Yet apart from its low profit margins - a big issue - and poor growth outlook - another big issue - the company looks attractive on the basis of its ROCE, CROCI, free cash dividend cover and high dividend yield. The key issue now is will its dividend be cut?
Its big problem is that its main sources of profit either come from a declining industry (distributing printed newspapers and magazines) or ones with high levels of competition (parcels). It also has a business called Pass My Parcel which is tapped into the growing retail click-and-collect market but isn't yet making any money.
There is some revenue growth potential from parcels and click-and-collect which has the scope to nudge profit margins up a bit. Contributions from these businesses should offset the lost profits from the Education business sold recently.
I know this business quite well having followed it as an analyst back in the City over a decade ago. It still has the same chief executive who has done a good job of managing it. Yet, the stock market really doesn't like the shares right now with the share price indicating that a dividend cut is a possibility. In my opinion, they are rightly viewed as a high-risk share.
A cut is possible but maybe not just yet. The company is due to release a trading update next Monday (24th July 2017) which could shed more light on this issue.
(Disclosure: Phil Oakley owns shares in Connect Group)
If you have found this article of interest, please feel free to share it with your friends and colleagues:
We welcome suggestions for future articles - please email me at analysis@sharescope.co.uk. You can also follow me on Twitter @PhilJOakley. If you'd like to know when a new article or chapter for the Step-by-Step Guide is published, send us your email address using the form at the top of the page. You don't need to be a subscriber.
This article is for educational purposes only. It is not a recommendation to buy or sell shares or other investments. Do your own research before buying or selling any investment or seek professional financial advice.