Is the current ratio an outdated measure of company safety?
One of the most commonly cited measures of a company's financial strength is something known as the current ratio. It is a measure of liquidity and compares a company's current assets - defined as assets that can be turned into cash within one year - with its current liabilities (those which have to be paid within one year).
Generally speaking, if a company has more current assets than current liabilities - a current ratio of more than 1 - it is deemed to have a satisfactory financial position. The bigger the current ratio is the safer a company might be. In other words it is seen to have little chance of going bust in the near future.
But is it really as simple as that? Can an investor quickly compare two numbers and come to the conclusion that a company is safe or not?
My view is that in most cases they cannot and should not. The current ratio has many drawbacks and needs to be treated with care by users of financial statements. It can give conflicting and misleading messages of a company's liquidity and financial strength.
In this article I will look at some of the issues with this popular ratio and give some suggestions as to what investors should focus on instead.
Phil Oakley's debut book - out now!
Phil shares his investment approach in his new book How to Pick Quality Shares. If you've enjoyed his weekly articles, newsletters and Step-by-Step Guide to Stock Analysis, this book is for you.
Share this article with your friends and colleagues:
The basics
The current ratio is very easy and quick to calculate. You can get all the numbers you need to calculate it from a company's balance sheet. You just need to divide the value for current assets by the value for current liabilities.
Current ratio = Current assets/Current liabilities.
Let's calculate the ratio for a real-life company. I am going to use pub company JD Wetherspoon as this is a business that hopefully most readers will understand.
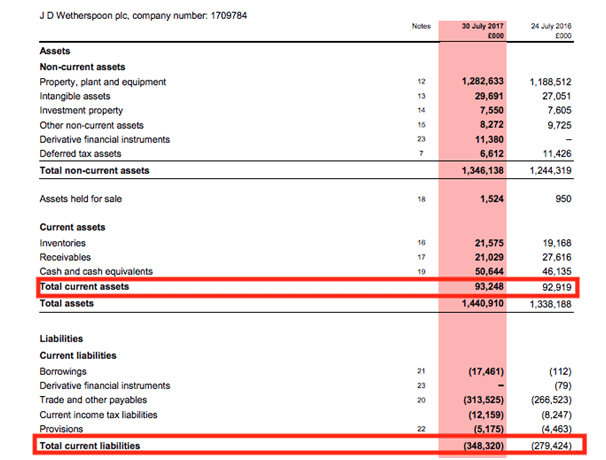
Below is a screenshot of Wetherspoon's latest year end balance sheet (30th July 2017). We can see that at that date it had £93.2m of current assets - the sum of inventories of goods, receivables (money owed by customers) and cash balances.
(You might be wondering why a pub company has receivables given that most customers settle their bills immediately when they pay for their food, drinks and accommodation. In Wetherspoon's case, receivables relate to rebates due from suppliers and money paid in advance to settle liabilities after the year end)
At the same date, it had £348.3m of current liabilities made up of borrowings that had to be repaid within one year, trade payables (the amount it owed its suppliers), outstanding tax bills and provisions for liabilities, expenses that have been incurred but not paid and money that has been received but not earned (known as deferred income).
You can find all this information in SharePad.
If we calculate JD Wetherspoon's current ratio for 2017 it comes out at 0.268 times compared with 0.333 times in 2016. This is telling us that current liabilities are more than three times as big as current assets.
A simple interpretation of the current ratio might be telling us that Wetherspoon is in dire financial straits and could be at risk of insolvency due to its very poor liquidity.
In fact, nothing could be further from the truth. The company has recently posted record trading profits whilst its share price trades close to record highs. If the company was in trouble then it seems that the stock market is not particularly worried about it.
So why might the current ratio giving us the wrong message about a company?
There are lots of reasons but two stand out.
We are very pleased to announce that
we are the proud WINNER of the
BEST INVESTMENT SOFTWARE AWARD 2017
As voted by SHARES magazine
Thank you everyone who voted for us
The ratio is a snapshot on one day
Income and cash flow statements tells us how much income and cash has flowed in a business throughout a year. The balance sheet only gives us the financial position of a company at the end of a year or reporting period.
The values of current assets and current liabilities might be very different at different times of the year. This can certainly be true for seasonal businesses which build up inventories (stocks) ahead of peak trading periods or pay suppliers at different times of the year.
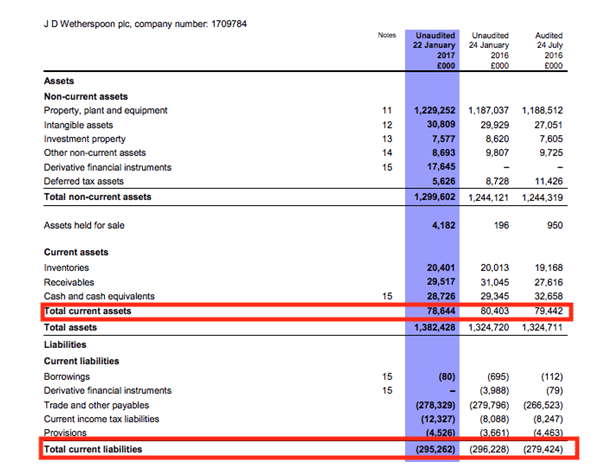
This doesn't seem to be the case with Wetherspoons as its half year balance sheet seems to have very similar levels of current assets and liabilities to the end of the year. Increases in inventories, receivables and payables can be explained by the growth of the company. Its current ratio remains very low at 0.27 times.
It ignores the flows of cash in a business throughout the year
A pub business such as Wetherspoons is constantly buying stocks of food and drink and selling them. At the same time it will rack up bills to pay its suppliers and incur tax liabilities.
So the amounts of current assets and liabilities can change as the company trades throughout the year. But the current ratio ignores how fast the inventories and debtors are turned back into cash and how long the company takes to pay its suppliers.
Wetherspoon does not have any customers that owe it money so we can ignore this current asset. What we want to get a feel for is how quickly it turns its stocks into cash (stock days) and how long it takes to pay its suppliers (trade creditor days).
You can get a rough estimate of this by calculating the ratios shown in the table below. The information is available in the notes to the accounts. SharePad users do not have to worry about calculating these as they are done for you and can be found in the Ratios tab of the Financial view for a company.
Please note that the disclosed cost of sales is rarely just the cost of stocks and associated trade payables so these calculations should only be used as a rough - but quite useful - guide.
JD Wetherspoon stock days and creditor days
|
� '000 |
2017 |
2016 |
|
Cost of sales (A) |
1,470,273 |
1,432,400 |
|
Inventories (B) |
21,575 |
19,168 |
|
Trade payables (C) |
162,058 |
133,899 |
|
Days in year (D) |
365 |
366 |
|
|
|
|
|
Stock days (B/A) x D |
5.4 |
4.9 |
|
Creditor days (C/A) x D |
40.2 |
34.2 |
|
Difference (days) |
34.9 |
29.3 |
Wetherspoon turns its stocks of food and drink into cash in just over 5 days but doesn't have to pay the bills for them until 40 days after delivery. This is a massive cash flow benefit for a company.
Looking at this another way: Wetherspoon can order and sell huge amounts of stock before it has to start paying its suppliers because it can turn the stock into cash before the first bill for supplies is due.
The ability to turn stock into cash very quickly explains why Wetherspoons can have liabilities for trade payables that are many times the value of its outstanding stocks. In turn, this also explains why its current ratio is so low but is not a problem.
A company can have a large current ratio but if it cannot turn its stocks and receivables into cash before it has to pay its suppliers then it may face a problem.
Is the current ratio an outdated measure?
I think there are strong grounds for arguing that it is.
The current ratio is a throwback to the days when asset-intensive companies dominated the economy and when balance sheets were used as one of the main ways of valuing companies and determining how safe they might be.
Balance sheets remain a useful resource for investors, with caveats about snapshots etc., but today the focus on liquidity and safety is best appraised by looking at a company's cash flow statement.
In fact there are grounds for arguing that a high current ratio is a sign of financial weakness rather than financial strength. This is because large amounts of inventories and receivables eat up cash flow and increase the amount of capital employed in a company.
Conversely, an increase in trade payables caused by extending the time to pay suppliers will increase current liabilities and may worsen a company's current ratio but will actually be a source of extra trading cash flow. How can that be a bad thing?
So changes in the current ratio may give an opposite and misleading indication of a company's financial health.
The current ratio also ignores other assets that can be sources of cash to settle liabilities such as property sales which are a regular feature of running a large pub company like JD Wetherspoon. It also ignores the cost of regular cash liabilities such as topping up final salary pension fund shortfalls.
Furthermore, current liabilities such as short-term borrowings may not need assets to pay them if they can be rolled over into fresh borrowings. This is rarely a problem for healthy companies.
What should investors look at instead?
I would suggest you look at the ability of a company to convert trading (operating) profits into operating cash flow and hopefully see that cash flow grow over time.
Then you should look at how that operating cash flow can be used to settle the most pressing liabilities such as tax and interest on borrowings.
Let's return to JD Wetherspoon to see how it has been getting on in this respect.
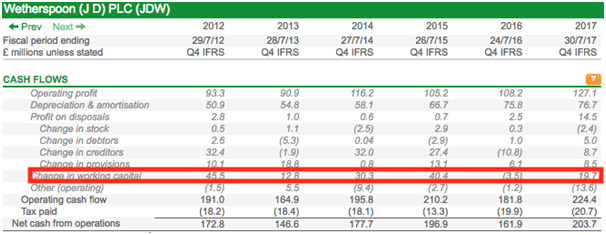
We can see that operating cash flow has not been going up in a straight line but the company has been generating plenty of it compared with its operating profits (thanks in no short measure to a large non-cash depreciation expense being added back to profits). Given the asset-intensive nature of pub companies, it would have been quite worrying if this had not been the case.
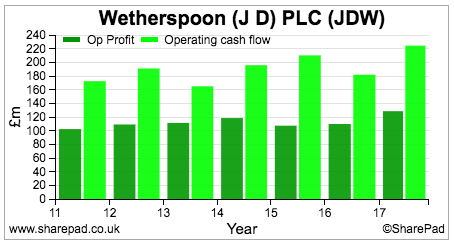
What we can also see on the cash flow statement above is that in most years the company has been able to gain a source of cash flow from working capital by increasing its creditors.
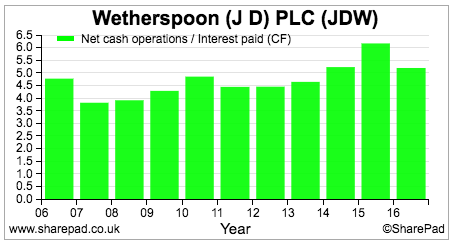
Now let's look at the ability of this operating cash flow to pay tax and interest. To make things easier, I'll assume that tax gets paid first and then see how many times net operating cash flow (operating cash flow less tax paid) covers the cash interest bill on borrowings.
Cash spent on replacing existing assets when they are worn out - maintenance capex - is ignored here. Whilst it is essentially for the long term health of the business it is usually ignored when looking at cash flow available to pay interest.
Wetherspoon is in reasonable shape on this measure with interest covered five times.
Companies with high current ratios and weak cash conversion
There are quite a few companies out there with high current ratios and poor cash conversion. This does not mean that they are financial basket cases but shows that perhaps the current ratio is not as useful as people have been led to believe.
|
TIDM |
Name |
MCap. (m) |
Current ratio |
Op. cash |
Op. cash |
|
BDEV |
Barratt Developments |
�6,242.30 |
3.3 |
69.3 |
72.7 |
|
BWY |
Bellway |
�4,207.00 |
3.7 |
44.9 |
47 |
|
FEVR |
Fevertree Drinks |
�2,288.70 |
3.5 |
71.4 |
58 |
|
RDW |
Redrow |
�2,178.10 |
3.2 |
58.7 |
-4.1 |
|
BVS |
Bovis Homes Group |
�1,487.40 |
3.5 |
62.4 |
33.5 |
|
CNE |
Cairn Energy |
�1,248.70 |
3.9 |
16.9 |
15.8 |
|
OPHR |
Ophir Energy |
�457.20 |
7.9 |
-301.6 |
-81.4 |
|
OBD |
Oxford BioDynamics |
�204.80 |
6.8 |
72.8 |
50.1 |
|
FDL |
Findel |
�134.20 |
3.3 |
-41.5 |
62.8 |
|
STVG |
STV Group |
�131.20 |
3.1 |
41.1 |
64 |
The poor operating cash conversion of housebuilders is easily explained by the buying of land which is classified as inventory and reduces operating cash flow. Fevertree is a fast-growing business and therefore it is not unusual to see high levels of inventory and receivables build up.
STV and Findel may require a bit more scrutinising.
Companies with low current ratios and strong cash conversion
|
TIDM |
Name |
MCap. (m) |
Current ratio |
Op. cash conversion |
Op. cash conversion 5y avg |
|
ULVR |
Unilever |
�121,592.30 |
0.7 |
118.7 |
121.1 |
|
RB. |
Reckitt Benckiser |
�45,373.00 |
0.6 |
120.3 |
119.1 |
|
CCL |
Carnival |
�35,915.20 |
0.2 |
167.2 |
178 |
|
REL |
RELX |
�35,489.20 |
0.4 |
134.3 |
138 |
|
IMB |
Imperial Brands |
�29,854.70 |
0.6 |
192.6 |
141 |
|
IHG |
InterContinental Hotels |
�8,112.60 |
0.7 |
134.4 |
127.9 |
|
WTB |
Whitbread |
�6,486.40 |
0.3 |
127.9 |
126.3 |
|
INF |
Informa |
�6,015.20 |
0.5 |
152.9 |
148.1 |
|
MRW |
Morrison (Wm) |
�4,950.60 |
0.4 |
288.3 |
286.7 |
|
UBM |
UBM |
�2,833.10 |
0.5 |
110.9 |
138.6 |
If you have found this article of interest, please feel free to share it with your friends and colleagues:
We welcome suggestions for future articles - please email me at analysis@sharescope.co.uk. You can also follow me on Twitter @PhilJOakley. If you'd like to know when a new article or chapter for the Step-by-Step Guide is published, send us your email address using the form at the top of the page. You don't need to be a subscriber.
This article is for educational purposes only. It is not a recommendation to buy or sell shares or other investments. Do your own research before buying or selling any investment or seek professional financial advice.