How you make (and lose) money from owning shares
People buy shares because they think they will make money from owning them. The possibility of losing money is not usually uppermost in their thoughts.
Yet experience tells us that we can and often do lose money from shares.
How many of us really think about the fact that, when we are buying a share, someone else is selling it? Do you ever ask yourself: What does the seller know that I don't? If you don't then you should start doing so. It might save you a lot of money in the long run.
People sell shares for different reasons. Sometimes they are selling to raise some cash. But on other occasions they decide to sell because they think the price of the share is too high or that the profits of the company behind the share will struggle to grow or might even fall in the future - or both. The buyer thinks the exact opposite. One of them will be right and the other will be wrong.
Why am I going on about this?
Well, in order to make money from shares you first of all have to try not to lose any. Losses are very hard to recover from. I'm sure many of you will know that if an investment you buy halves in price it will have to double in the future for you to just get your money back. This very much easier said than done. That's why you should try very hard to avoid losses in the first place.
In this article, I am going to take you back to the basics of stock market investing and get you to think about how you make and lose money from buying and owning shares. I think many people fail to grasp this which increases the risk that they will make mistakes and lose money. By really understanding this very simple but powerful process I am confident that it will help you become a better investor.
Phil Oakley's debut book - out now!

Phil shares his investment approach in his new book How to Pick Quality Shares. If you've enjoyed his weekly articles, newsletters and Step-by-Step Guide to Stock Analysis, this book is for you.
Share this article with your friends and colleagues:
The simple maths of share ownership
When you buy a share the amount of money that you will ultimately make or lose is determined by two - and only two - things:
- The change in the share price between when you buy and sell the share.
- The amount of dividends that are paid to you whilst you own it.
Added together these two things make up your total return from owning a share. Try not to forget this.
Total return from a share = Change in share price + total dividends received
Let's say you buy a share for 100p. You own it for five years and then sell it for 120p. During that time you have also been paid an annual dividend of 5p per share giving you 25p of dividends in total. Your total return from owning the share is:
- The change in share price of 20p (The 120p you get from selling less the 100p you paid for it)
- 25p of dividends - five years of 5p per share paid.
- A total gain of 45p (20p + 25p) or 45% (45p/100p).
When you are investing you should always keep coming back to this simple sum. Every bit of research that you do on a company should boil down to two very basic questions:
- What does it mean for the value of the company? (This will eventually be reflected in the share price)
- Will it change the size of dividends that a shareholder will receive?
Anything you do that isn't helping to answer these questions is essentially time wasted. So let's have a look at these two bits separately.
The crucial difference between share prices and dividends
One of the most important things to understand about the two types of return from shares is that they are different. You need to be very mindful of this when you are investing.
Share prices can make you very rich if they have gone up a lot by the time you decide to sell. However, gains can be taken away very quickly if a company hits tough times or the stock market crashes.
Dividends are very different. Once they have been paid they cannot be taken away from you. If you don't like the risk of losing money then investing in shares that pay big dividends can be a less stressful way to make money over the long run.
This is why I am usually very wary of buying shares in companies where the share price has gone up a lot faster than their profits and the valuation is high. I feel that the risk of losing money is too high because there is a lot of potential for the share price to fall. I'll show you how this can happen later on.
You need to work out how much risk you are prepared to take on and what kind of share you will be comfortable owning.
How share prices are determined
Share prices are no different to any other prices. They are determined by the forces of demand and supply. When a company is very popular with investors its share price tends to go up. It tends to fall when it is out of favour and struggling.
The famous investor Benjamin Graham summed up the workings of the stock market very well. He said in the short run it was a voting machine based on popularity but in the long run it was a weighing machine where share prices would ultimately reflect the real value of a business. In the meantime share prices can drift a long way from their true or intrinsic value - i.e. they can be undervalued or overvalued.
In reality, the market value of a company and its share price are determined by two things:
- Its profits and cash flows.
- The value attached to those profits or cash flows. This is often expressed as a multiple of them such as the price to earnings (PE) ratio.
So share prices change if:
- profits or cash flows change.
- stock market valuations change.
Now let's look at the dividend part of the total return from a share.
The dividends you receive
This is a lot more straightforward. To pay a sustainable dividend a company needs to be profitable and have enough spare cash (free cash flow). It does not have to pay a dividend to shareholders. Instead, profits and cash flows can be retained in the business and invested with the hope of making higher profits and cash flows in the future.
So the amount of dividend a shareholder will receive will depend on a company's profitability and how much of those profits the directors want to pay out.
Total return and investment risks
Focusing on total returns really helps to focus your thinking when you are researching a company. What it forces you to do is direct your attention on the only two things that really matter:
- The outlook for future profits. These will determine both the share price and dividend payments.
- The valuation of the shares. What you pay for them will have a large bearing on how much money you will ultimately make or lose.
This approach also gets you to think a lot about the risks you are potentially exposing yourself to. These are:
- Business risks - whether a company can grow and hang on to its profits. This depends on things such as how good its products are and how much competition it faces.
- Share price risk - whether you are paying too much for the shares. Buying shares with high valuations (such as a high PE ratio) can be more risky than buying shares with lower valuations.
If a company's profits stand a good chance of growing in the years ahead then you can begin to see how you might end up making money from owning the shares. Higher profits could cause the share price to go up and see you being paid a growing stream of dividend payments. But, if those shares are too highly priced and the company fails to live up to lofty expectations then even if profits and dividends increase you could still end up losing money - sometimes a lot of money - if the share price falls.
So how on earth can you try and work out whether the maths of share ownership are going to work in your favour? You can never be certain but like lots of things with investing, you can get a good feel of what the future might bring by studying what has happened in the past.
By working out what has made up the total return of a share in the past, you can start to weigh up whether you might make or lose money by buying the shares today. As with lots of things in life, the best way to understand something is to look at some real world examples.
Making and losing money from shares in the real world
Remember, the return from shares will come from one or a combination of three things:
- The change in profits.
- The change in the valuation of those profits.
- The dividends received.
I am going to show you five different shares and how they have made or lost money in the past. By doing this, you can learn a great deal which then helps you ask some important questions about how it might do so in the future.
All the information and tools you need to work things out are available in ShareScope and SharePad.
Whitbread - returns driven by profits growth
If you have owned shares in Whitbread - known for its Costa Coffee and Premier Inn hotels - for the last ten years you will probably be very happy with your investment as it has increased more than fourfold.
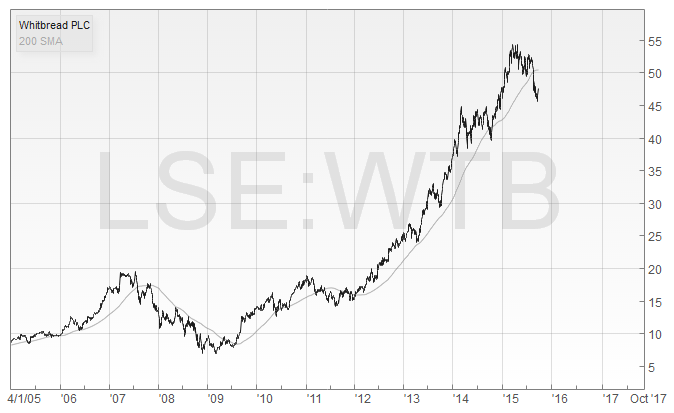
The breakdown of its total returns is shown below with an explanation afterwards:
| Whitbread plc | |||
|---|---|---|---|
| Share price 10y ago (p) | 973 | ||
| EPS 10y ago (p) | 40.7 | ||
| PE 10y ago | 23.9 | ||
| Share price today (p) | 4598 | ||
| TTM EPS (p) | 207.3 | ||
| TTM PE | 22.2 | ||
| Total Returns: | |||
| Change in share price (p) | 3625 | 373% | |
| Dividends received (p) | 445 | 46% | |
| Total gain or loss (p) | 4070 | 418% | |
| Explanation of total returns | |||
| Change due to profits (p) | 3982 | 97.90% | Change in EPS x PE 10y ago |
| Change due to valuation (p) | -358 | -8.80% | Change in PE value x Current EPS |
| Return due to share price (p) | 3625 | 89.10% | |
| Return due to dividends (p) | 445 | 10.90% | |
| Total return (p) | 4070 | 100.00% | |
| TTM = Trailing 12 month | |||
How to explain a share's past total returns
I want to know how a company's total returns in the past have been achieved before I think about buying it. As I said, earlier I'm wary of shares where valuations are high and the share price has been going up because of higher valuations being placed on them (a higher multiple of profits such as a PE ratio).
It's fairly easy to work out how the returns have been achieved.
Dividends are easy. It's just the total amount of dividends that have been paid over a time period.
Share price changes can be broken down into changes from profits and changes in valuation. To work out the change due to profits you take the change in EPS and multiply it by the PE ratio when the share was bought.
So for Whitbread above, EPS has increased by 166.6p to 207.3p. Multiply this by the PE 10 years ago of 23.9 and you get a gain of 3983p.
To explain the change due to valuation you take the current EPS and multiply it by the change in the PE ratio:
207.3p x (22.2-23.9) = 207.3p x -1.7 = -358p.
So the share price has been reduced by 358p due to the fall in the PE ratio.
Add these two changes together and you will see the total change in the share price explained:
3983p - 358p = 3625p.
What you can now hopefully see is that the £40.70 of money per share you would have made has been largely due to the stellar growth in Whitbread's share price which makes up nearly 90% of the total return.
Yet ten years ago Whitbread shares were hardly a bargain at nearly 24 times its most recent earnings per share (EPS). Whitbread shareholders have made money because investors have still been prepared to pay very high PE ratios for its shares - presumably because they were right in thinking that profits could keep on growing strongly.
EPS is four times higher now than it was a decade ago. So the gain in value to the shareholder has largely tracked the growth in profits. The PE ratio has only declined from 23.9 times to 22.2 times. As I have just explained, had it stayed at 23.9, the gain in the share price from higher EPS would have been even higher at 3983p. The share price gain has been reduced by 358p due to the lower valuation (the lower PE ratio).
Over the same time period investors have also pocketed 445p of dividend but this has only made up just over 10% of their total return.
So what does this mean if you own Whitbread shares or are thinking of buying some?
Two simple questions spring to mind:
- Can Whitbread continue to keep on producing big increases in profits in the years ahead? Check out the broker forecasts in SharePad and ShareScope. Also go into the news section and read what the company has been saying about current trading.
- Will investors still be prepared to put a very high valuation on the shares?
Making investment gains in line with profits growth is usually a good sign. The risk for Whitbread shareholders is that profits growth slows down in the future. If it does then a PE of 22 could quite quickly become a PE of 15 or less - known as PE multiple contraction. As I will show you later, this can have a devastating effect on your returns. You can end up losing money even if profits are still growing.
Associated British Foods - returns driven by valuation increases
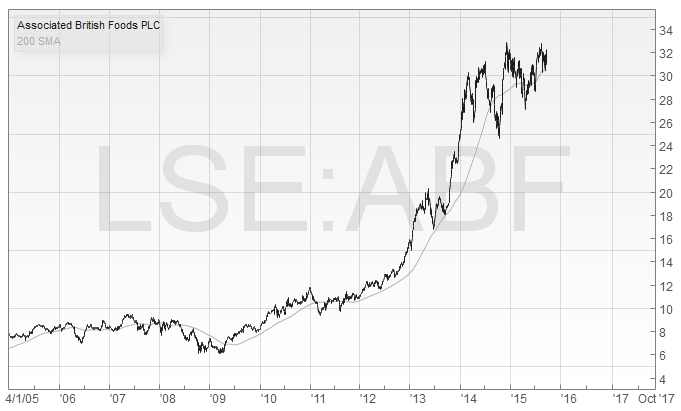
Investors in Associated British Foods have tripled their money during the last ten years. But the bulk of the gains have been driven by valuation increases - an expanding PE ratio. This is due to the fact that the share price has gone up a lot faster than the profits of the company.
| Associated British Foods | |||
|---|---|---|---|
| Share price 10y ago (p) | 815 | ||
| EPS 10y ago (p) | 46.6 | ||
| PE 10y ago | 17.5 | ||
| Share price today (p) | 3140 | ||
| TTM EPS (p) | 98.1 | ||
| TTM PE | 32 | ||
| Total Returns | |||
| Change in share price (p) | 2325 | 285% | |
| Dividends received (p) | 227.2 | 28% | |
| Total gain or loss (p) | 2552.2 | 313% | |
| Explanation of total returns | |||
| Change due to profits (p) | 901 | 35.30% | Change in EPS x PE 10y ago |
| Change due to valuation (p) | 1424 | 55.80% | Change in PE value x Current EPS |
| Return due to share price (p) | 2325 | 91.10% | |
| Return due to dividends (p) | 227.2 | 8.90% | |
| Total return (p) | 2552 | 100.00% | |
| TTM = Trailing 12 month | |||
However, the shares now trade on a very demanding valuation of 32 times EPS - the kind of valuation that needs strong profits growth to justify - but profits growth has stalled. The big potential risk with a share like this is that the PE multiple could collapse if profits don't start growing again. Dividends don't look big enough to offset this. Can shareholders bank on holding on to the big share price gains?
GlaxoSmithkline - dividends to the rescue
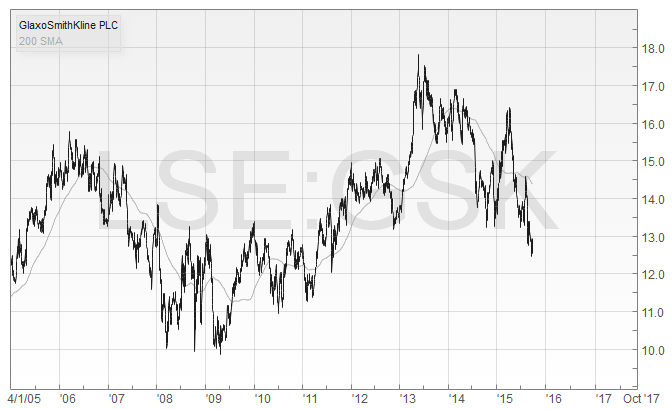
On the basis of its share price alone, GlaxoSmithkline has been a disappointing ten year investment. Its share price has fallen as investors' enthusiasm for the company has cooled somewhat.
| GlaxoSmithKline | |||
|---|---|---|---|
| Share price 10y ago (p) | 1417 | ||
| EPS 10y ago (p) | 66.5 | ||
| PE 10y ago | 21.3 | ||
| Share price today (p) | 1274 | ||
| TTM EPS (p) | 77.9 | ||
| TTM PE | 16.4 | ||
| Total Returns | |||
| Change in share price (p) | -143 | -10.09% | |
| Dividends received (p) | 607 | 43% | |
| Total gain or loss (p) | 464 | 32.75% | |
| Explanation of total returns | |||
| Change due to profits (p) | 243 | 52.40% | Change in EPS x PE 10y ago |
| Change due to valuation (p) | -386 | -83.20% | Change in PE value x Current EPS |
| Return due to share price (p) | -143 | -30.80% | |
| Return due to dividends (p) | 607 | 130.80% | |
| Total return (p) | 464 | 100.00% | |
| TTM = Trailing 12 month | |||
Although profits are higher, the stock market's lower valuation of them has more than offset this. The big compensating factor has been the 607p of dividends received over the last decade. This shows that you can still make money from owning shares even if the share price goes down and you hold on to them for long enough. The question for investors here is will the dividends keep on rolling in?
Aggreko - how paying high prices can really hurt your wealth
Not that long ago, Aggreko was a hot share to own. The provider of temporary power generators had been growing its profits at a rapid rate and investors were prepared to pay nearly 26 times earnings for the shares back in 2010. For a while the shares continued to do very well but they have come crashing down as profits growth has become a lot more difficult to achieve.
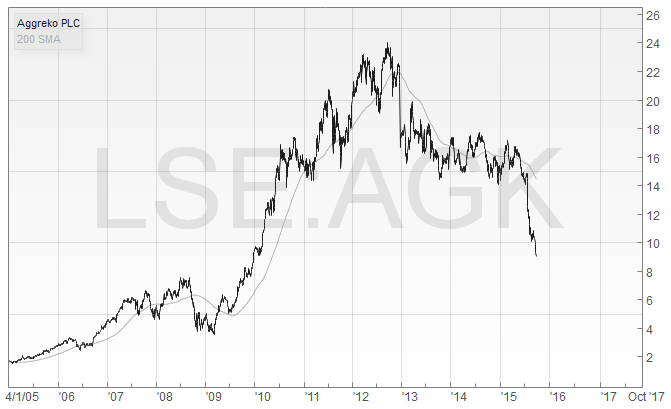
Investors have lost faith in this company and the PE ratio has more than halved. Shareholders have lost money even though profits have gone up.
| Aggreko | |||
|---|---|---|---|
| Share price 5y ago (p) | 1583 | ||
| EPS 5y ago (p) | 61.1 | ||
| PE 5y ago | 25.9 | ||
| Share price today (p) | 952 | ||
| TTM EPS (p) | 74.1 | ||
| TTM PE | 12.8 | ||
| Total Returns | |||
| Change in share price (p) | -631 | -40% | |
| Dividends received (p) | 166.1 | 10% | |
| Total gain or loss (p) | -464.9 | -29% | |
| Explanation of total returns | |||
| Change due to profits (p) | 337 | 72.40% | Change in EPS x PE 10y ago |
| Change due to valuation (p) | -968 | -208.20% | Change in PE value x Current EPS |
| Return due to share price (p) | -631 | -135.70% | |
| Return due to dividends (p) | 166.1 | 35.70% | |
| Total return (p) | -465 | 100.00% | |
| TTM = Trailing 12 month | |||
This highlights a very important lesson for all investors: The price you pay for a share has a big impact on the returns that you get from it. Pay too much and you can lose money.
JD Sports - How buying cheap can deliver stunning results
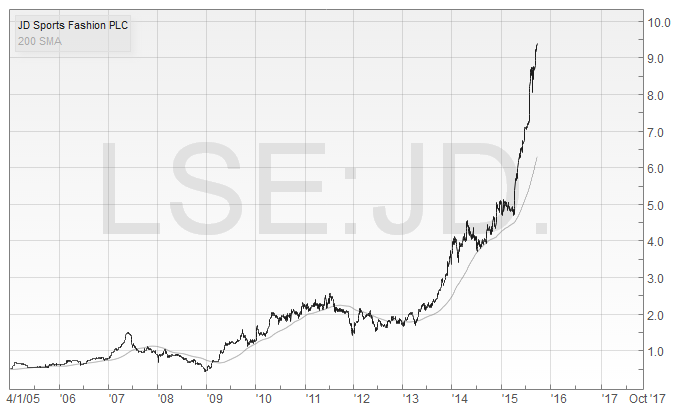
You could have picked up shares in JD Sports for just over 9 times earnings ten years ago which most people would say is a very undemanding valuation. A combination of rapid profit growth and a doubling of the PE ratio has seen its shares deliver stunning results to any patient, long-term shareholder.
With the shares more richly-valued today, profits will have to keep growing strongly for investors to make good money over the next ten years. It's unlikely that the PE ratio will double again.
| JD Sports | |||
|---|---|---|---|
| Share price 10y ago | 56.25 | ||
| EPS 10y ago | 6.2 | ||
| PE 10y ago | 9.1 | ||
| Share price today | 930 | ||
| TTM EPS | 51.3 | ||
| TTM PE | 18.1 | ||
| Total Returns: | |||
| Change in share price | 873.75 | 1553.33% | |
| Dividends received | 45.2 | 80% | |
| Total gain or loss | 918.95 | 1633.69% | |
| Explanation of total returns | |||
| Change due to profits | 409 | 44.50% | Change in EPS x PE 10y ago |
| Change due to valuation | 465 | 50.60% | Change in PE value x Current EPS |
| Return due to share price | 874 | 95.10% | |
| Return due to dividends | 45.2 | 4.90% | |
| Total return | 919 | 100.00% | |
| TTM = Trailing 12 month | |||
To sum up:
- Focus on total returns (share prices + dividends) not just share prices when you are investing.
- Study risks as well as returns.
- You are exposed to business and share price risks when you own a share.
- Knowing what has driven shareholder returns in the past is important.
- Past share price gains can disappear, dividends paid can't.
- Be wary of shares with high valuations and where share prices have increased faster than profits.
- Dividend shares can be less risky.
- Buying cheaper shares is usually better than buying more expensive ones
If you have found this article of interest, please feel free to share it with your friends and colleagues:
We welcome suggestions for future articles - please email me at analysis@sharescope.co.uk. You can also follow me on Twitter @PhilJOakley. If you'd like to know when a new article or chapter for the Step-by-Step Guide is published, send us your email address using the form at the top of the page. You don't need to be a subscriber.
This article is for educational purposes only. It is not a recommendation to buy or sell shares or other investments. Do your own research before buying or selling any investment or seek professional financial advice.