Stock Watch: A&J Mucklow
For this week's stock watch I've decided to look at a company that requires some different tools of analysis. I am going to be looking at small cap property company A&J Mucklow (MKLW) which trades as a real estate investment trust (REIT).
Regular readers will know that I place a heavy emphasis of performance metrics such as return on capital employed and free cash flow when I am analysing a company. However, there are some companies and sectors which aren't particularly suited to these measures. Property companies are a good example of this.
Property companies create or destroy value for their shareholders in two main ways:
- Income from rents which is paid out as dividends - a cash return.
- Gains or losses from the annual changes in the value of their investment properties - usually a non-cash return unless the property is sold.
Both these returns to investors are shown in a property company's income statement. Because changes in property valuations tend to be non-cash in nature they are not picked up in the analysis of a company's free cash flows in the usual way. A gain in value is recorded as an increase in operating profit but is subtracted from its free cash flows because no flow of cash has taken place.
If you were looking at a property company on a measure such as free cash flow or cash return on capital invested (CROCI) you might mistakenly come to the conclusion that you were looking at a bad business. To avoid this you need to look at property companies in a different way. In particular:
- The growth in dividends per share from year to year.
- The changes in net asset value per share (NAVps) which reflects the changes in the valuation of the company's investment properties (these are revalued every year).
Before we get into looking at how A&J Mucklow stacks up on these measures, some brief bits of background information are needed.
Phil Oakley's debut book - out now!
Phil shares his investment approach in his new book How to Pick Quality Shares. If you've enjoyed his weekly articles, newsletters and Step-by-Step Guide to Stock Analysis, this book is for you.
Share this article with your friends and colleagues:
What are REITS?
REITS (pronounced "reets") were set up by the Labour government in 2006. In exchange for a one-off payment, commercial property companies could have all their rental income from investment properties and any gains in value exempted from corporation tax. A&J Mucklow has been a REIT since July 2007.
In return, the REIT has to pay 90% of its exempt profits to shareholders in dividends. These dividends are known as property income distributions (or PIDs for short). PIDs are subject to 20% withholding tax (20% of the gross dividend is handed over to the government) but investors with REIT shares in ISAs or SIPPs can have this reclaimed for them by their stockbroker.
Using SharePad to analyse REITS
There are some key numbers and ratios that you should look at when checking out whether a REIT is a good business or not. I've created a customised results table in SharePad for analysing REITs:
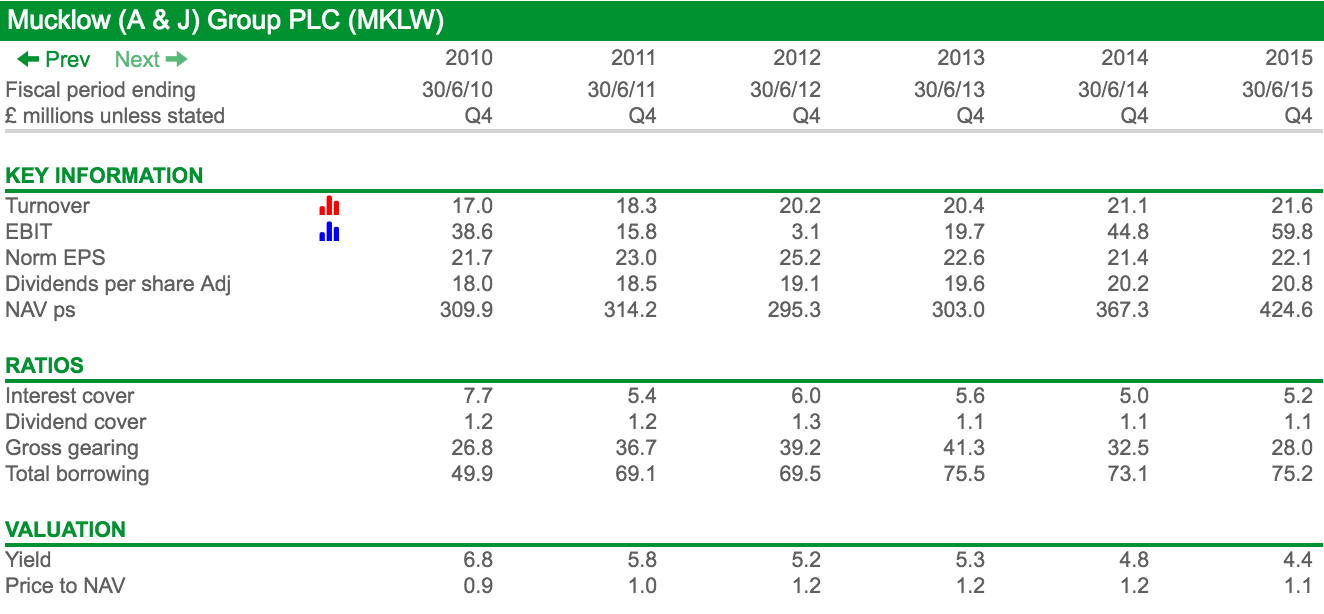
Let's look at some of these items in closer detail:
Property companies are no different to any other type of company in that revenues are their lifeblood. Ideally you want to be looking at a company with a rising flow of income or turnover.
For a REIT such as Mucklow, virtually all of its turnover will come from the rents paid by the tenants of its properties. These are mainly industrial properties (warehouses etc.) located in the Midlands.
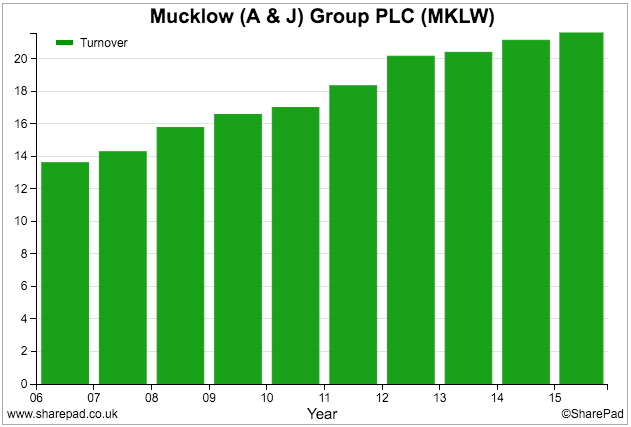
As you can see, the company has a good track record of increasing its turnover - even during the recession years of 2008-09.
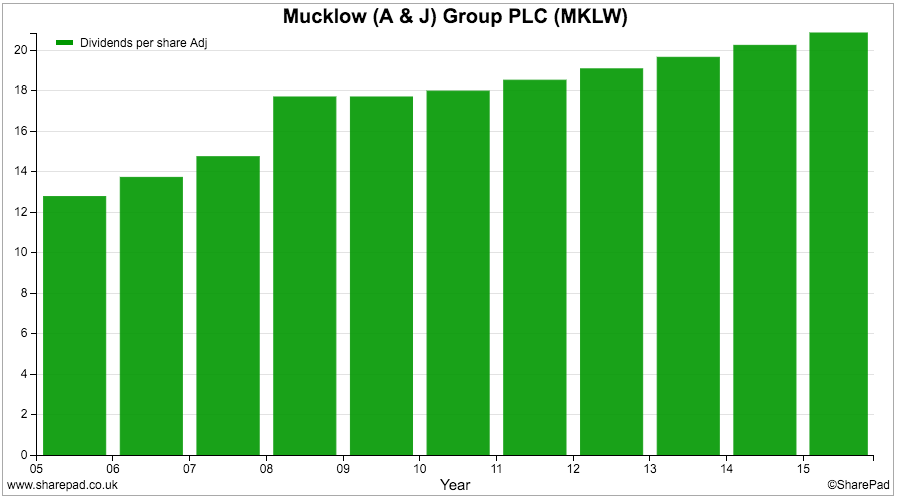
This consistency in income generation has allowed it to reward its shareholders with a steadily rising dividend payment as well - a good sign.
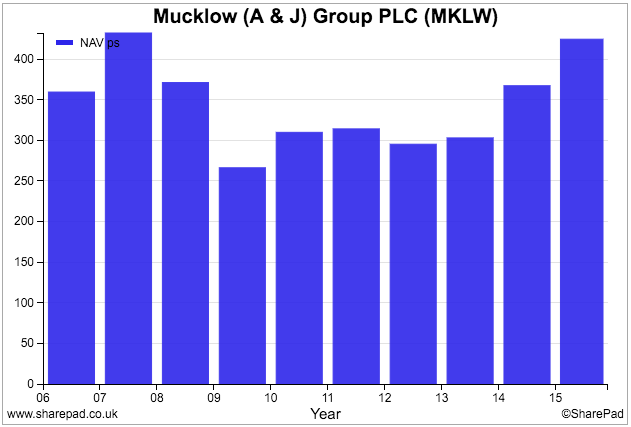
After taking a hammering during the last recession, Mucklow shareholders have benefitted from a strong recovery in the net asset value per share (NAVps) - essentially the value of its properties less borrowings. We will look at this in more detail later on.
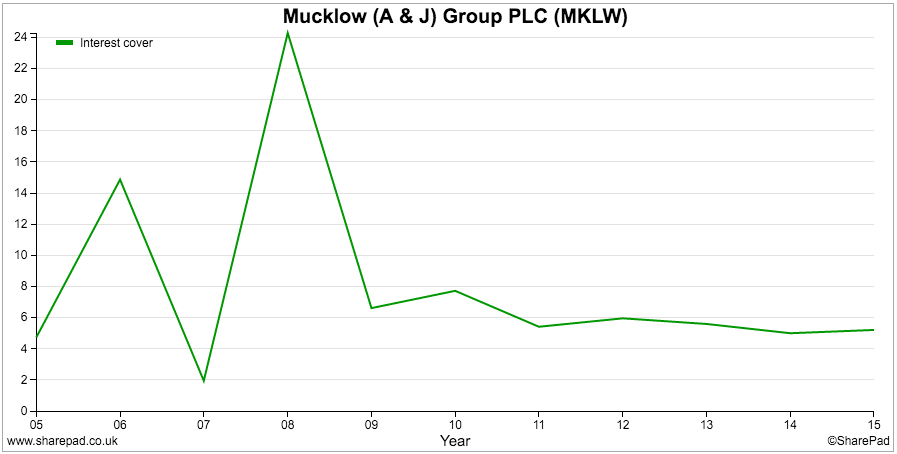
One of the numbers that you need to pay particular attention to when looking at a REIT is its debt levels and the ability to pay that debt as measured by the interest cover ratio.
Mucklow seems to be very prudently financed and doesn't seem to be carrying too much debt.
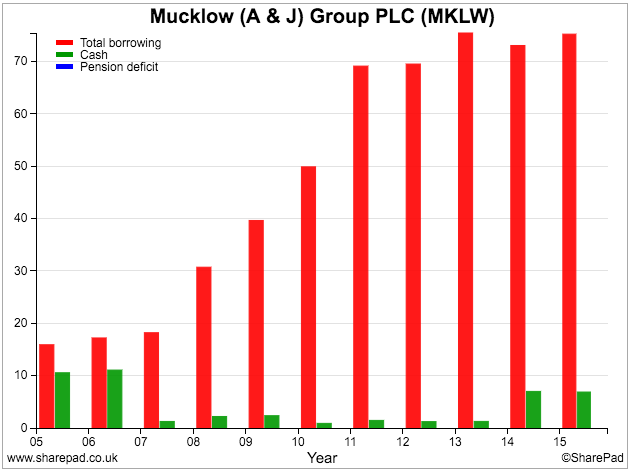
As you can see, total borrowings have been quite stable during the last few years. As the value of its property portfolio has been rising at the same time its gearing levels have been falling. Looking at gearing levels - debt as a proportion of equity - is more important than the absolute value of debt.
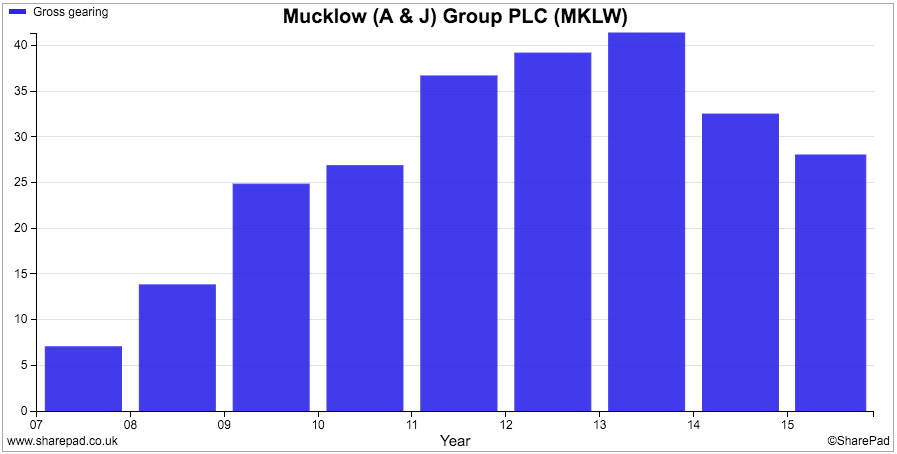
Mucklow's gross gearing is less than 30% which is a very safe level. Having said that, industrial properties are more risky given their exposure to the ups and downs of the UK economy and it is in the best interest of shareholders to have low levels of debt secured against them.
Interest cover levels are healthy too at over 5 times current trading profits.
Mucklow shareholders should probably not worry too much about debt levels. The company's reasonably strong financial position may also give it the opportunity to buy more properties if good ones become available.
A closer look under the bonnet
SharePad is telling us that Mucklow is in pretty good shape. I've also had a dig into the company's annual reports to look at some of the key specific measures you should be looking at when you are weighing up a property company. These are shown in the table below:
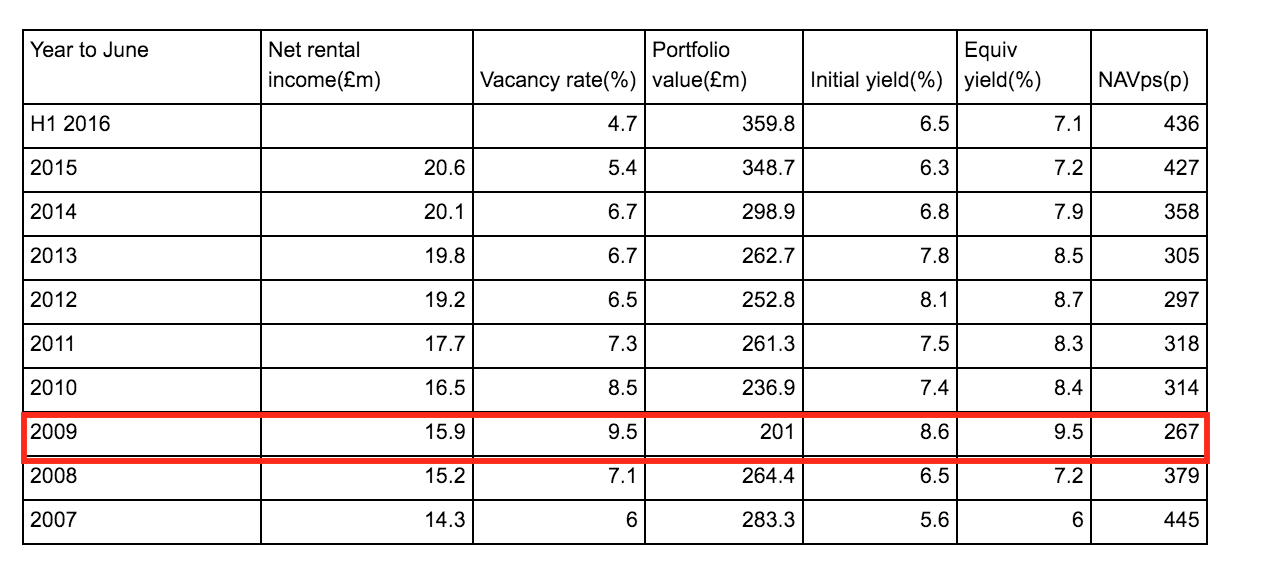
As I mentioned earlier, Mucklow's net rental income (income from tenants less the costs of managing properties) has been very resilient even in the last recession of 2008-09. Other key measures though have been more volatile and investors would do well to recognise this.
I have highlighted the year to June 2009 to show you how bad times were during the last recession so that you can more usefully examine Mucklow's current performance.
Let's look at vacancy rates first. They are currently very low at 4.7% (another way of looking at this is that the properties have a 95.3% occupancy rate) indicating that demand for properties is very high. This is a good sign but may be indicating that there is less scope for further improvement.
The valuation of the property portfolio has also continued to increase. Investment properties are valued by having a yield (interest rate) applied to their current or expected future rental income. The lower the yield, the higher the valuation of the property tends to be.
Say a company has current annual rental income of £10m and market yields for this type of property are 10%, the value of the property would be £100m (£10m divided by 10%). If yields fall to 5% and rental incomes stay the same, the value increases to £200m (£10m divided by 5%).
Now let's look at yields. For REITs, yield shows the current rental income as a percentage of the value of the property portfolio. Thus, yields are usually reflective of the change in property values. As rents are usually tied down for a fixed period, changes in rental income usually lag changes in property values. A higher yield is suggestive of lower or falling property values; a lower yield of rising values.
The Initial yield measures the current annualised rents as a percentage of the portfolio value. In 2009 these yields were a very high 8.6% reflecting the falling value of industrial properties. Since then they have come down to 6.5% as property values have increased but industrial property yields still remain higher than the yields on government bonds, offices and prime shopping centres due to them having a less secure income stream. They were as low as 5.6% during the peak of the last property boom in 2007.
Equivalent yields take into account the future cash flows at current rental values and any uplifts in rents that may occur in the future. This might happen if a tenant starts out with a low rent which then reverts to higher current market rent after a period of time. These future rental cash flows are discounted at an interest rate which gives a value which equals the current market value of the properties concerned. This makes the calculation of the equivalent yield identical to the way gross redemption yields are calculated on bonds.
Mucklow's equivalent yield is currently 7.1%. This is much higher than government bonds and can explain why some investors find industrial properties an attractive home for their money.
Only they can decide whether the interest rate is high enough to compensate them for the possible risks of lower rents if there is an industrial recession in the future.
You will see from the table above that yields are low compared with the ten year history. The rise in property prices in recent years has driven yields down (known in the financial trade as yield compression). Investors have been prepared to accept lower yields on properties as interest rates on alternative investments such as bonds have fallen as well.
However, this trend has been slowing down and initial yields have even increased slightly. This might be a warning sign to investors that people are beginning to become a bit nervous about the future prospects for industrial property due to a slowdown in the economy.
Perhaps future gains in net asset value per share will be harder to come by?
Valuation and future prospects

The shares of AJ Mucklow are trading at a 10% premium to net asset value per share. This suggests that the share are not really a bargain at current levels unless NAV and dividends can grow strongly.
Given that yields have stopped falling recently it seems reasonable to assume that NAV growth might be more modest than it has been in recent years. Dividends are expected to keep growing and the dividend yield of 4.5% might attract some income seeking investors.
There are lots of REITS listed on the London Stock Exchange. SharePad allows you to compare them using a sector filter. Below I've looked at how Mucklow stacks up against a large selection of REITS.
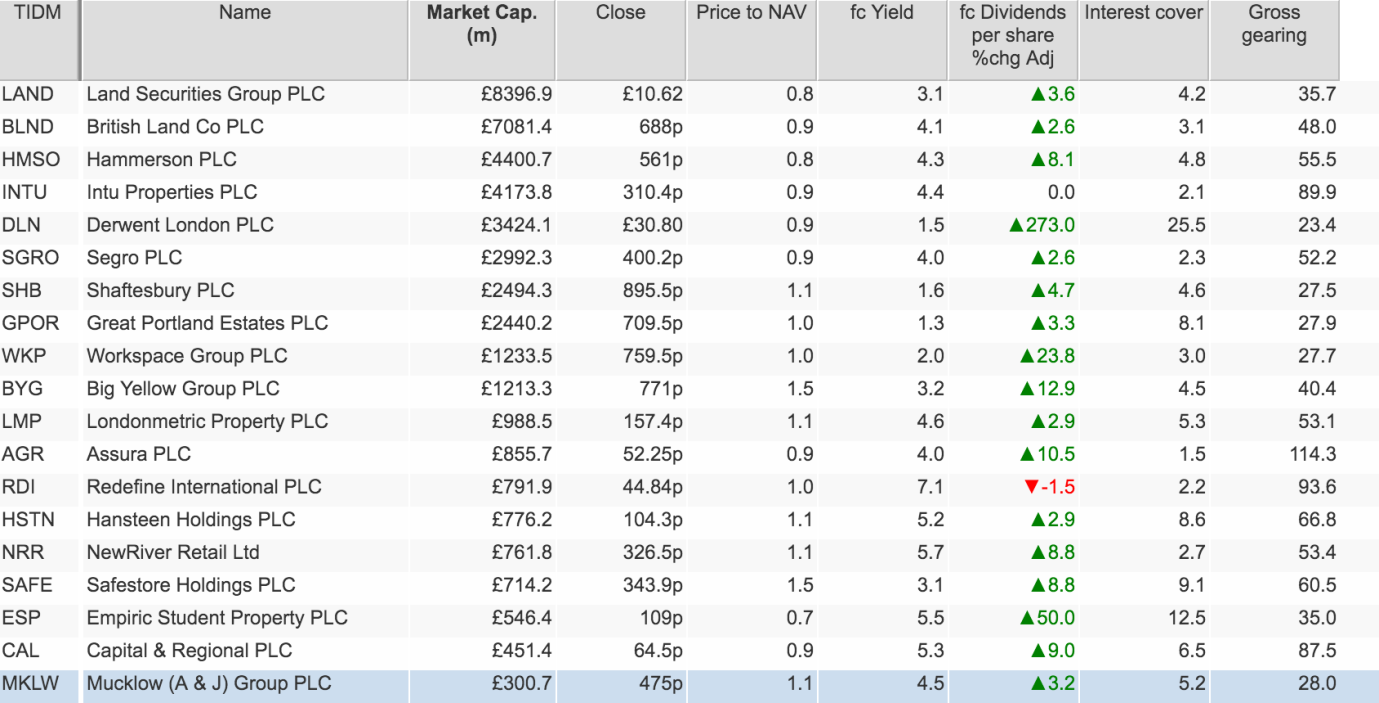
What is quite striking is the large number of REITS with shares trading below NAVps. There are also some quite high dividend yields on offer. Mucklow looks more expensive on a price to NAV basis but offers one of the more attractive dividend yields.
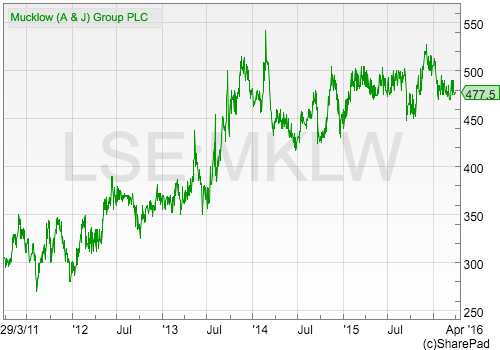
Looking at a share's valuation history is always a useful exercise. It can tell you whether a share looks cheap or expensive compared with how it has traded in the past. Below is a chart showing Mucklow's price to NAV per share history over the last decade.
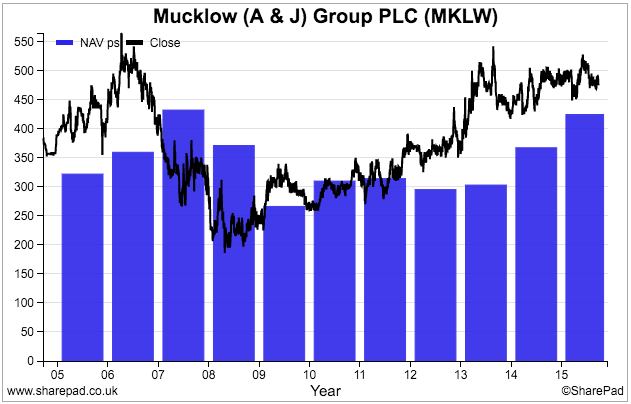
On the basis of this chart it's hard to argue that the shares are depressed or really cheap. Only during the recession years of 2008 and 2009 have the shares traded at a big discount to NAV which is usually the best time to buy property shares. The shares are currently trading at a premium to NAV but that premium is not as big as it was in 2007.
Let's take a closer look at City analysts' forecasts. I've set up a custom results table in SharePad so that I can do this with any share that I want to look at.
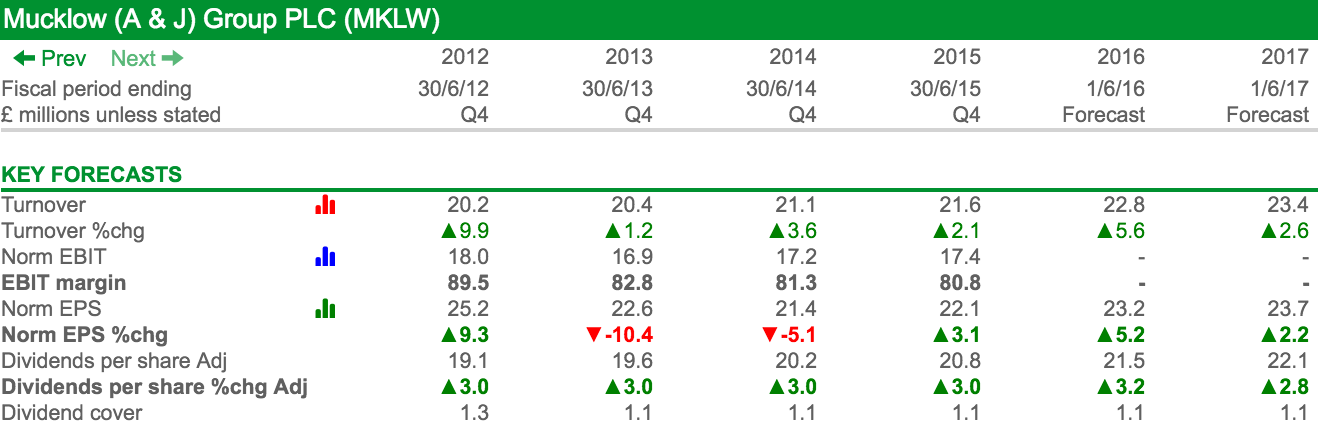
Analysts are expecting modest growth in turnover and earnings per share (EPS) with dividend growth of about 3%. As you can see, the dividend cover is very low at 1.1 times. Don't worry about this, this is true of all REITS which have to pay out 90% of their investment property profits as dividends to shareholders.
To sum up
- Property companies aren't best suited to cash flow and ROCE analysis.
- It is better to focus on income growth and the changes in net asset value per share.
- A&J Mucklow has proven to be a very resilient business over the economic cycle.
- Its portfolio of Midlands industrial properties are currently experiencing buoyant demand.
- Current trading is good. Occupancy rates are high and rental income is growing.
- The company's finances are very strong with low levels of gearing and comfortable levels of interest cover.
- The value of its properties has grown strongly in recent years as yields have fallen.
- Property yields have stopped falling recently. This may mean future growth in net asset value per share (NAVps) is more difficult to achieve.
- The shares do not look particularly cheap as they trade at a premium to NAVps (price to NAV is greater than 1) but this is not unusual looking at its share price history.
- A dividend yield of 4.5% might attract income seekers given that modest dividend growth of around 3% is expected by City analysts.
If you have found this article of interest, please feel free to share it with your friends and colleagues:
We welcome suggestions for future articles - please email me at analysis@sharescope.co.uk. You can also follow me on Twitter @PhilJOakley. If you'd like to know when a new article or chapter for the Step-by-Step Guide is published, send us your email address using the form at the top of the page. You don't need to be a subscriber.
This article is for educational purposes only. It is not a recommendation to buy or sell shares or other investments. Do your own research before buying or selling any investment or seek professional financial advice.