Are cash profits a better valuation measure than free cash flow?
Regular readers will know that I am a big fan of using free cash flow when it comes to analysing a company's financial performance. I am certainly not alone in this.
Free cash flow has become a very popular measure because profits are too easy to fudge. It's too easy for directors to pull the wool over investors' eyes with a creative stroke of the pen when putting together the annual accounts. Free cash flow gets you closer to the truth about what's really going on with a company.
Yet free cash flow is not without its issues. It has to be used carefully if you are to get the most out of it (see Free cash flow isn't always what it seems).
Let me explain.
Phil Oakley's debut book - out now!

Phil shares his investment approach in his new book How to Pick Quality Shares. If you've enjoyed his weekly articles, newsletters and Step-by-Step Guide to Stock Analysis, this book is for you.
Share this article with your friends and colleagues:
The search for sustainable free cash flow
Some investors screen for companies with lots of free cash flow. They then look to see if they can buy the shares for a reasonable price. Typically they will look for low multiples of Price to free cash flow (P/FCF) or a high Free cash flow yield (FCF/P).
There's nothing wrong with this at all. You just have to make sure that the free cash flow numbers you are looking at are a reliable indication of what the company can produce year in, year out. If they are not then you could fall into a trap of buying a company which you think is growing its free cash flow and becoming more valuable when it isn't.
Just as company management can manipulate profits they can manipulate cash flows as well - especially in the short run. They can do things such as cutting back on investing in new assets (capex) but one of the quickest ways to boost cash flow is to reduce the amount of working capital tied up in the business.
Working capital is the money that a company needs to operate on a day-to-day basis. Some companies need more of it than others. That's because they might need to hold lots of stock, pay for things in advance and sell goods to customers on credit. All this can be a drain on a company's cash resources.
Reducing working capital boosts a company's operating cash flow - the amount of cash coming in from trading activities. However, this boost might not be permanent and might confuse an investor into thinking that a company's sustainable cash flow is higher than it might be in reality.
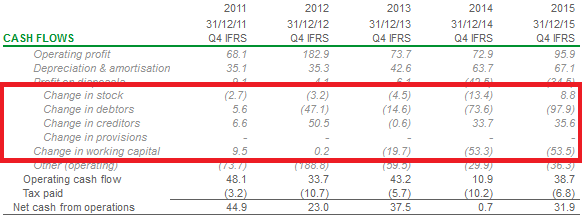
The change in working capital is recorded in a company's cash flow statement - in the Net cash from operations section at the top. SharePad users can see this on the Cashflow tab in the Financials view. In the example below, you can see the working capital has increased by £53.5m in the latest accounts. You can also see how this has been achieved in the breakdown above it.

In this article, I am going to spend some time looking at this working capital issue because I believe it is too easily overlooked by investors. Bear in mind that annual cash flows can also be distorted by one-off cash flows like tax refunds, pension fund top ups, litigation and restructuring costs. I'll look at this in a future article.
Let's take a look at an example to understand this better.
Close Cut Lawn Mowers plc
Close Cut is a maker of top quality lawn mowers. It has been consistently profitable but some of the big shareholders have become a bit frustrated with the company's cash flow performance. They reckon it's not as good as its competitors and can improve. If it does then there's a good chance the share price will go up and make them a bit richer.
The board of directors agrees and hires a hot shot new chief executive who comes with a big reputation for improving company cash flows. He sets up a simple plan to:
- Reduce the amount of finished products and spare parts held in stock. This has been running at 20% of annual sales. The new target is 15%
- Get customers to pay their invoices quicker. Trade debtors (unpaid invoices at the year end) have been around 8% of sales. The target is to reduce this to 7%.
- Delay paying the company's suppliers a bit more. The target is to increase trade creditors from 15% to 17% of sales.
If the new boss is successful he will reduce the amount of working capital tied up in the business and improve operating and free cash flow. This project is his main priority before trying to grow sales and profits the following year.
Below is a summary of the company's profits, working capital position and free cash flow performance. The chief executive explains his grand plan to shareholders in the annual report.
| Close Cut Lawn Mowers plc | Last year | This year | Next year |
|---|---|---|---|
| Sales | 100 | 100 | 105 |
| Operating Profit | 20 | 20 | 21 |
Stocks | 20 | 15 | 15.75 |
| Trade debtors | 8 | 7 | 7.35 |
| Trade creditors | -15 | -17 | -17.85 |
| Working Capital | 13 | 5 | 5.25 |
% Sales | |||
| Stocks | 20.00% | 15% | 15% |
| Trade debtors | 8.00% | 7% | 7% |
| Trade creditors | -15.00% | -17% | -17% |
| Working capital | 13.00% | 5.00% | 5.00% |
Operating cash flow | |||
| Profit | 20 | 20 | 21 |
| Depreciation | 10 | 10 | 10.5 |
| change in stocks | -2 | 5 | -0.75 |
| Change in debtors | -1 | 1 | -0.35 |
| Change in creditors | 1 | 2 | 0.85 |
| Operating cash flow | 28 | 38 | 31.25 |
Tax paid | -4 | -4 | -4.2 |
| Capex | -10 | -10 | -10.5 |
| Free cash flow | 14 | 24 | 16.6 |
The plan works. With profits staying the same as last year, cash flow improves dramatically. A reduction in stocks brings in £5m, better credit control brings in another £1m and taking longer to pay suppliers brings in another £2m.
Last year the change in working capital saw £2m of cash flow out of the company. This year it has brought in £8m - a swing of £10m. Operating cash flow has improved from £28m to £38m and free cash flow has surged from £14m to £24m.
The previously grumpy shareholders are delighted. As the company has previously been valued at 10 times free cash flow they reckon that this free cash flow improvement is going to increase its value from £140m to £240m and make them rich.
They are wrong. The improvements are not a permanent increase in cash flow.
Reality bites
Whilst the chief executive is celebrating his big bonus payment as a result of his efforts he quickly sobers up when his finance director brings him down to earth with some harsh realities.
The amount of stock has been reduced to its limit. The warehouses are struggling to supply customers and provide spare parts. There's no way that stock levels can go lower than 15% of sales without compromising customer service.
Customers are complaining that they can't pay them any faster without putting themselves in financial difficulties. They only way they will do so is if they can buy lawnmowers for 20% less than they are now.
Suppliers are getting grumpy and don't want to be kept waiting any longer for their money. They feel they've been squeezed enough.
The chief executive's heart sinks. He knows that he has maxed out on the gains from squeezing working capital. He also knows that if there is no cash boost next year from changes in working capital then operating and free cash flow will fall. This is exactly what happens.
Even with sales and profits growing, the ratio of working capital to sales stays the same and there is no cash flow improvement from it. Free cash flow falls back to almost the same level as it was before.
The lesson here is to be wary of companies that boost their cash flow from decreases in working capital. Whilst such moves are welcome they rarely lead to permanent improvements in free cash flow. You therefore need to be careful when valuing companies on the basis of free cash flow where this has occurred.
A real world example: Halfords

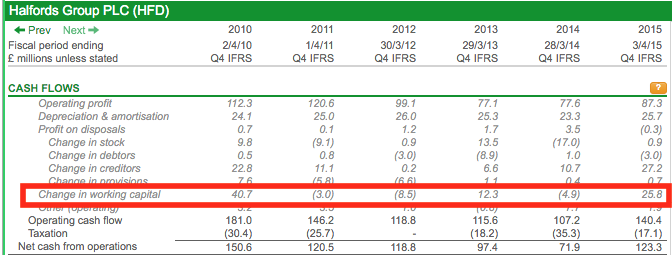
This looks like it could be happening with retailer Halfords. You can see in 2010 its operating cash flow benefitted from a big boost in cash of £40.7m from working capital. The following year this couldn't be repeated and operating cash flow fell.
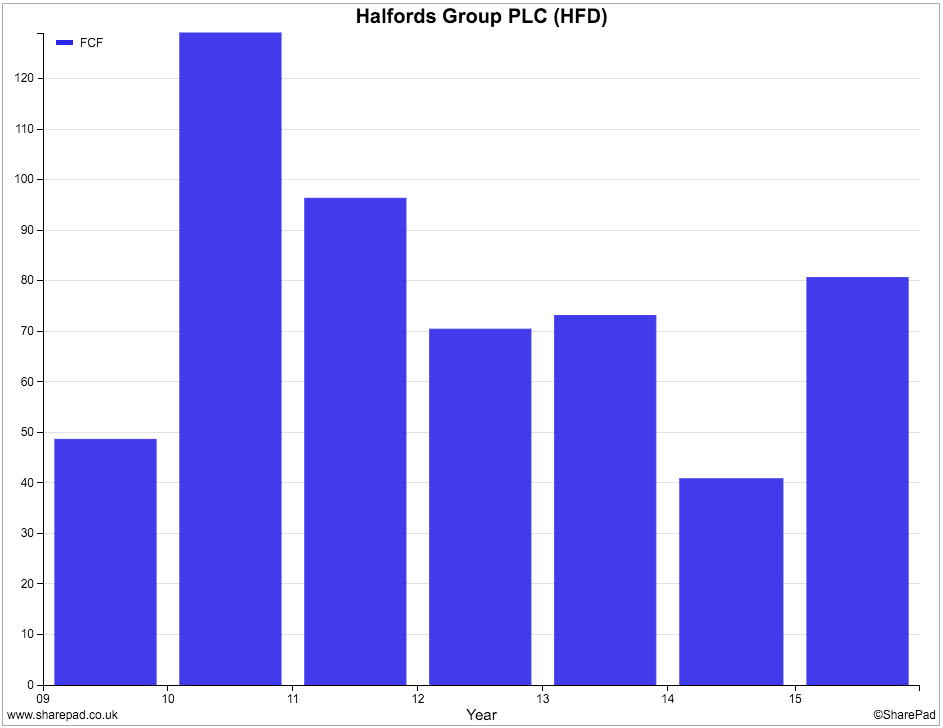
Move forward to 2015 and there was another big boost to operating cash flow from working capital of £25.8m as Halfords increased its creditors. You can also see that the amount of tax paid halved from the previous year. Although capex increased, free cash flow for shareholders doubled from £40m to £80m.

Free cash flow per share doubled from 20.7p to 40.8p. A investor looking at Halfords shares in April 2016 at a price of 389p might think that they can pick them up for less than ten times free cash flow (9.5 to be exact) which could be seen as an attractive price.
But could they be making a mistake?
Fast forward another six months to October 2015 and things are rather different.
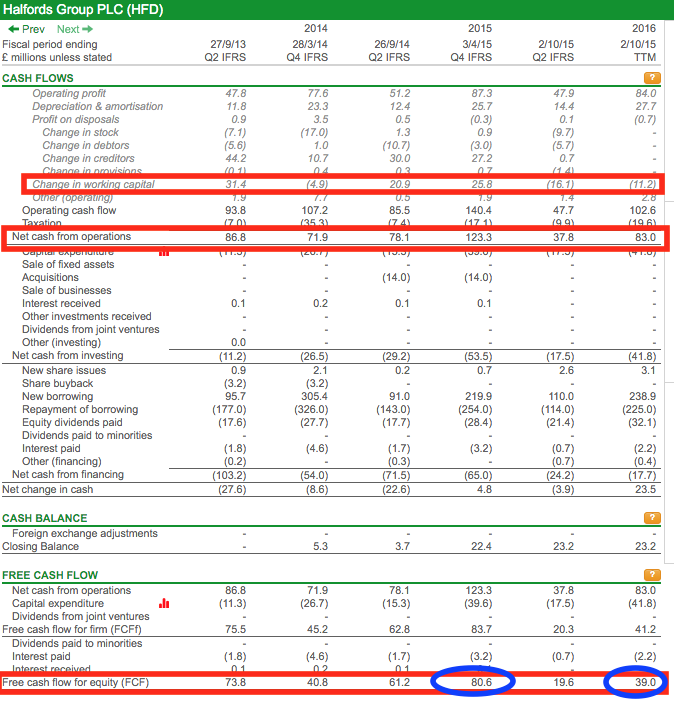
From looking at its half year results statement below I can see that Halfords' change in working capital is a negative £16.1m or minus £11.2m on a trailing twelve month basis.

Net cash flow from operating activities has moved sharply lower and free cash flow has too. Far from looking cheap, the shares look expensive on a TTM P/FCF of 19.9x.

Should we use cash profits for valuing shares instead?
The problem with using free cash flow to value companies is that the yearly movements in working capital can give investors a misleading picture of a company's sustainable free cash flow and possibly lead them to make mistakes when valuing it.
The solution to this problem could be to base share valuations on an estimate of a company's cash profits instead. Cash profits are calculated by adjusting profits for an estimate of maintenance or stay-in-business capex - the cash required to maintain the company's. This measure ignores the cash effects of changes in working capital.
See my article on How to work out a company's cash profit for more details.
This is the way that Warren Buffett values companies. He calculates cash profits (or owner earnings as he calls them) using the following formula:
Post-tax profit + Depreciation and amortisation - Stay-in-business capex.
Here's how Halfords looks on this measure.
| Halfords Cash profits(£m) | 2015 | TTM |
|---|---|---|
| Post-tax profit (net income) | 66.1 | 64.5 |
| Add Depreciation & Amortisation | 26.4 | 28.4 |
| Less 5yr avg capex | -25.6 | -29.6 |
| Cash profits | 66.9 | 63.3 |
| Diluted Shares (m) | 197.4 | 195.6 |
| Cash profit per share(p) | 33.9 | 32.4 |
| Share price(p) | 389 | 389 |
| Price to cash profit(x) | 11.5 | 12 |
I've used 5 year average capex figures as an estimate of stay-in-business capex. As you can see, the cash profits are very similar to net income suggesting that Halford's reported profits are very close to its actual cash profits. This will not be the case for every company but it is here. As a result, Halford's price to cash profit ratio will be very similar to its price to earnings (PE) ratio.
Does this mean investors should ignore free cash flow?
Definitely not.
Free cash flow remains one of the best ways of measuring a company's financial performance. It is one of the best ways of detecting poor quality profits and dodgy accounting (by comparing EPS with free cash flow per share) and can keep investors out of trouble.
Measuring the free cash flow return on capital invested (CROCI) is also a great hallmark of a good or bad business. The key here is to look at this over a reasonable period of time rather than one year in isolation.
However, when it comes to valuing a company's shares investors might be better served by using cash profits instead, especially where cash flows are subject to big changes from changes in working capital. It might protect them from thinking a share is cheap or expensive when it isn't.
We don't have a cash profits figure in SharePad but plan to add one. In the interim, you'll need to calculate it yourself but SharePad will provide post-tax profit, depreciation & amortisation and 5 year average capex.
To sum up
- The valuation of shares should be based on a measure of sustainable profits or cash flows.
- Free cash flow isn't always the best number for this.
- Free cash flow can be distorted by one-off effects such as tax refunds, litigation and restructuring costs as well as pension fund top ups.
- Cash flows from changes in working capital can lead to big changes in a company's operating and free cash flow.
- Management can boost operating and free cash flow by reducing working capital in the short run. This is a one-off rather than permanent boost to cash flow and can give a misleading measure of sustainable cash flows.
- Calculating cash profits is probably a better basis for valuing shares.
- Free cash flow still remains a very useful way of analysing a company's performance.
If you have found this article of interest, please feel free to share it with your friends and colleagues:
We welcome suggestions for future articles - please email me at analysis@sharescope.co.uk. You can also follow me on Twitter @PhilJOakley. If you'd like to know when a new article or chapter for the Step-by-Step Guide is published, send us your email address using the form at the top of the page. You don't need to be a subscriber.
This article is for educational purposes only. It is not a recommendation to buy or sell shares or other investments. Do your own research before buying or selling any investment or seek professional financial advice.