How much debt and cash does a company really have?
When you are studying a company's finances you are usually spending a lot of time looking at its three main financial statements:
- The income statement - showing how its profits were arrived at.
- The balance sheet - a statement of what it owns and owes.
- The cash flow statement - showing how much cash flowed in and out.
The income and cash flow statements show you what happened during the year. The balance sheet is different. It is a snapshot of the company's financial position on the last day of its financial year. This may not be true picture of the company's financial position throughout the rest of the year. In fact for some companies, the financial position can be very different.
This is a very important issue for investors to understand. The balance sheet is the main piece of information we have to try and work out things such as how much debt or cash a company has and how much money it has invested. Investors place a heavy reliance on debt and cash numbers when working out the valuation of a company's equity and calculating important ratios such as return on capital employed (ROCE).
It is quite understandable why companies would want to show their finances in the best possible light. However, if you are using the wrong debt and cash numbers to value a company and work out its ROCE you might be making a mistake.
Let's have a look at an example to show you why.
Phil Oakley's debut book - out now!
Phil shares his investment approach in his new book How to Pick Quality Shares. If you've enjoyed his weekly articles, newsletters and Step-by-Step Guide to Stock Analysis, this book is for you.
Share this article with your friends and colleagues:
Carillion and the effect of average debt levels
I wrote about construction and supports services company Carillion a couple of weeks ago (click here to read more). Carillion is very upfront with investors in telling them that its average net debt (total debt less cash) was around £369.1m higher than stated on its year end balance sheet (£538.9m average versus £169.8m year end).
If you were trying to work out the value of Carillion's shares by estimating the value of its assets or the enterprise value of its businesses - like in the sum-of-the-parts valuation shown below - and then taking away debt you could be overvaluing the equity by £369.1m or 86p per share based on 430m shares in issue. (Note: if you are valuing a company using EPS or free cash flow per share, the interest payments on all the debts throughout the year will be included; you don't need to worry about making valuation mistakes.)
| Carillion SOTP (£m) | Profit | Tax @20% | Post tax profit | Multiple | Value |
|---|---|---|---|---|---|
| Support Services | 146.6 | -29.32 | 117.3 | 13.7 | 160,636 |
| PPP | 46 | ||||
| Middle East Construction | 25.3 | -5.06 | 20.2 | 10 | 202.4 |
| Other Construction | 37.8 | -7.56 | 30.2 | 10 | 302.4 |
| Unallocated | -14.6 | 2.92 | -11.7 | 10 | -116.8 |
| Estimated Enterprise Value | 2,040.6 | ||||
Adjustments: | |||||
| Tax Assets | 103.8 | ||||
| Average net borrowings | -538.9 | ||||
| Pension deficit | -317.6 | ||||
| Minority interest | -23.8 | ||||
| Estimated Equity Value | 1,264.2 | ||||
| Shares (m) | 430.3 | ||||
| Value per share (p) | 293.8 |
So instead of estimating a per share value of 293.8p, you would be getting a value of 379.6p - a difference of 29.1%. You might come to the conclusion that Carillion shares are very cheap - they could be - when in reality they might not be.
If you were trying to calculate Carillion's ROCE you may also understate its capital employed and overstate its ROCE if you were using year end net debt figures. The calculation of capital employed has many different definitions depending on who you ask and which side of the balance sheet you use and whether to include things such as hidden debts and intangible assets. For this example I am going to keep it very simple and define it as total equity plus net borrowings.
If I use 2015 year end balance sheet figures for Carillion then I would have total equity of £1017.3m and net debt of £169.8m to give capital employed of £1187.1m. With EBIT of £235.4m this gives a basic ROCE of 19.8% (235/1187.1).
Using average net borrowings increases capital employed to £1556.2m and reduces ROCE to 15.1% (235.4.1556.2) - quite a big difference.
How to spot companies with higher average debts
Companies which have a seasonal bias to their sales such as retailers at Christmas, travel companies in the summer and house builders in the spring are prime candidates to have higher average levels of debt - or lower average levels of cash - than that shown on their balance sheet at the year end.
In the build up to their main selling period they build up stocks or buy services which eats up cash flow, pushes up debts and reduces cash balances. Then when customers pay them a large inflow of cash occurs which brings debt down or pushes cash balances up. It's no coincidence that many companies choose to have their year end when this happens.
But how do you go about spotting companies where this might be happening?
It's not easy. Not all companies will be as open as Carillion about their finances. That said there are ways to spot companies where the average net debt figure may be considerably higher than its year end figure.
1. Calculate the interest rate on average total borrowings
This approach doesn't always work but one possible sign is when a company's estimated interest rate on its average borrowings is very high - much higher than the general level of interest rates. You can estimate this figure by dividing the interest paid from the cash flow statement by the average level of total borrowings. SharePad can do this for you and you can add the results as a column to a list of shares or a portfolio.
Companies can be locked into long-term borrowing at very high historic interest rates but in today's world of low interest rates I'd be very surprised if most FTSE 350 companies were paying more than 5-6% to borrow money during the last 7 years.
The other main issue to be aware of is if a company repays a large amount of debt close to a year end. It will have most of the interest cost for a year of borrowing but the year end debt figure will have fallen significantly. This will make the average interest rate look high for the year but this would not be a trend that would continue into the following year.
Take a look at the table below. It shows two companies with very high average interest rates (I haven't converted them to percentages). Do they have higher average net borrowing or lower net cash balances or is there a simple explanation?
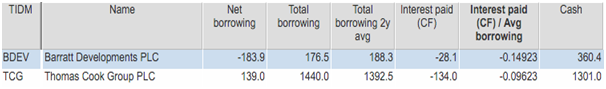
Let's take a look at Barratt Developments first. The company had net cash of £183.9m (shown as a negative net borrowing in SharePad) made up of total borrowings of £176.5m and cash balances of £360.4m.
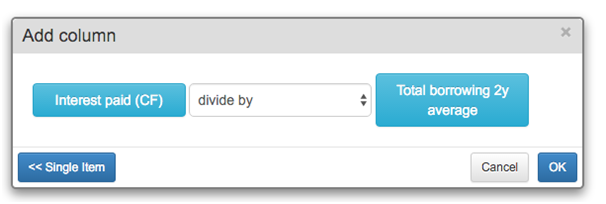
SharePad can calculate the average borrowing for the year by taking the average of last year's and this year's total borrowing figure - £188.3m. The cash flow statement shows a cash interest expense of £28.1m. Using the Combine item feature in SharePad's Add column dialog, I can get an estimate of the interest rate on the average level of borrowings.
This gives an answer of -0.14923 (because the cash interest paid is a negative number) or 14.92%. Is Barratt Developments really paying nearly 15% to borrow money in this low interest rate world?
Let's have a closer look to see if we can find out what's going on here. You will find most of the answers to your questions from reading the company's annual report.
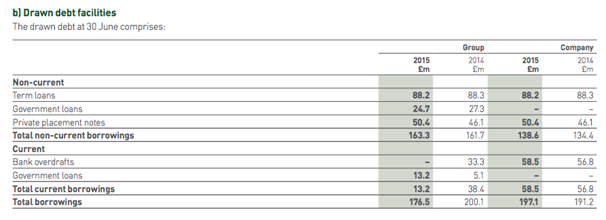
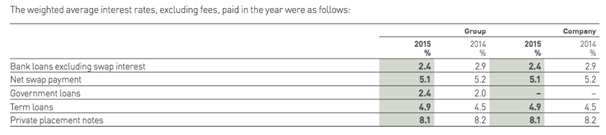
Above we can see the makeup of the company's borrowings. Below we can see the average interest rates paid on those borrowings. There's nothing to suggest that it is paying nearly 15% to borrow money.
The next step is to look at the company's interest costs in more detail. You will find this information in a note to income statement.
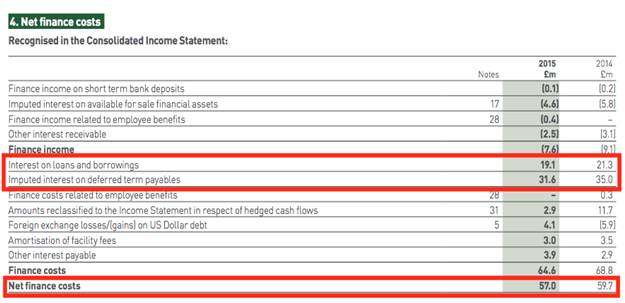
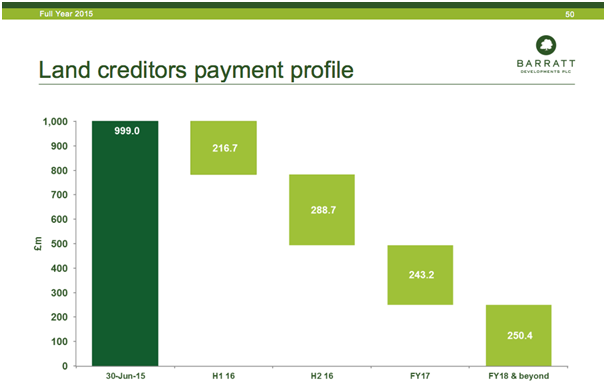
Here we can see an interest cost on loans and borrowings of £19.1m. There is also a significant non-cash interest charge of £31.4m related to the imputed interest on deferred term payables. What does this mean? Barratt buys land but often doesn't pay for it until planning permission is granted. The amounts of money owed are treated as trade creditors. The payment profile is shown in the chart below. The non-cash interest expense is the accounting treatment to match the cost of these creditors against the liability. No cash interest is paid. The seller of the land is effectively part financing Barratt's business with interest free credit.
So, apart from some expensive fees, there's nothing to suggest that average borrowing levels are higher throughout the year. But what about cash levels?
2. Look at changes in the balance sheet throughout the year
Most companies disclose two balance sheets a year - after six and twelve months. You can learn more about a company's finances by looking at the movements in borrowings and cash between the half year and full year balance sheets.
Let's take another look at Barratt.
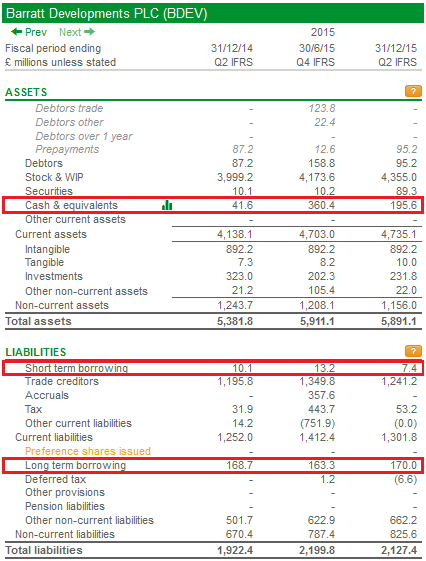
If you compare the balance sheet liabilities between the year end (June 2015) and the latest interims (December 2015) you can see that the overall level of borrowings is broadly the same. This can probably confirm that average debt levels do not change that much throughout the year. But cash levels do. At £195.6m they are nearly £165m lower than at year end. But they are £154m better than a year ago reflecting the improving health of the business.
How this cash balance was arrived at is shown in the cash flow statement below.
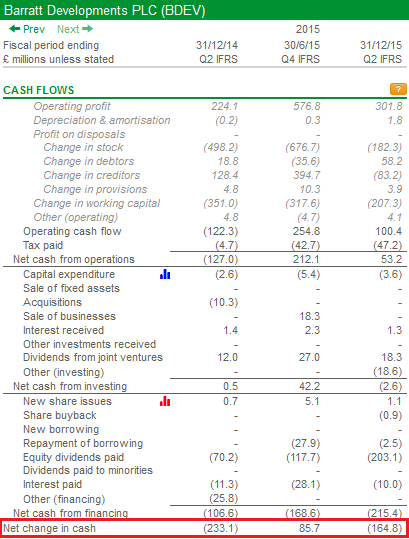
Most of the cash outflow can be explained by the payment of dividends. You can see that Barratt's cash flows are very different between the first and second half of its financial year which reflect the seasonality of its revenue and timing of cash payments.
You can also see that the net decrease of £233.1m at the half year stage (Dec 2014) turned into a net increase of £85.7m at the year end (June 2015). That's a £318.8m inflow of cash. If you go back to the balance sheet you can see that this inflow took the cash balance from £41.6m in December 2014 to £360.4m in June 2015.
But what was the average level of cash throughout the year? It is impossible to work out as an outsider but if you just take an average of £41.6m and £360.4m you would get a figure of £201m.
Net cash at June 2015 was £183.9m (Cash of £360.4m less borrowings of £176.5m). Using an average level of cash of £201m, and assuming that borrowings are stable throughout the year, gives a lower net cash figure of £24.5m.
Cash (£201m) less total borrowings (£176.5m) = Net cash (£24.5m)
The difference of £159.4m is the equivalent of a 16p per share reduction of the year end tangible net asset value per share of 278.7p.
Thomas Cook
Tour operators are probably one of the best examples of how net borrowing levels can change throughout a year. The business is highly seasonal with most of the profits and cash flows coming during the summer months. Thomas Cook - like many tour operators - actually loses money during the winter months.
I've calculated Thomas Cook's implied interest rate to be 9.6%.
The company reports to shareholders every three months and tells them its net borrowing levels. The table below shows the trend in net borrowing throughout the financial year. Thomas Cook's year end is in September when its net debt is at its lowest. It is highest at the end of the first quarter.
| Period Ending | Net debt (£m) | Change (£m) |
|---|---|---|
| 09/2014 Q4 | 326 | |
| 12/2014 Q1 | 1262 | 936 |
| 03/2015 Q2 | 700 | -562 |
| 06/2015 Q3 | 392 | -308 |
| 09/2015 Q4 | 139 | 253 |
| 12/2015 Q1 | 1195 | 1056 |
Just taking an average of the closing quarterly balances for 2014/15 would give £623m - a big difference of £484m from the year end value.
There's also the possibility that Thomas Cook has very high interest costs for a good reason - its business is very risky. The credit rating agencies - who give an opinion on the creditworthiness of companies to bond investors - give the company a B rating which means Thomas Cook's bonds do not have investment grade status and cannot be purchased by many professional bond fund managers.
To sum up
- Average levels of debt and cash throughout the year can be very different from those on the balance sheet at a year end.
- This can lead to investors overvaluing a company and its ROCE.
- Companies tend to choose their year ends when their finances are at their best.
- High implied interest rates on average debt levels can be a sign that average debt levels are higher than those reported at year end.
- Cash balances can vary significantly throughout the year depending on the timing of sales and cash payments.
- Read the company's annual report to find out why debt levels and cash levels might change. Sometimes there is a simple explanation.
If you have found this article of interest, please feel free to share it with your friends and colleagues:
We welcome suggestions for future articles - please email me at analysis@sharescope.co.uk. You can also follow me on Twitter @PhilJOakley. If you'd like to know when a new article or chapter for the Step-by-Step Guide is published, send us your email address using the form at the top of the page. You don't need to be a subscriber.
This article is for educational purposes only. It is not a recommendation to buy or sell shares or other investments. Do your own research before buying or selling any investment or seek professional financial advice.