Tutorial: Moving Averages
In ShareScope you can click on Help and access a series of tutorials that give you an overview of the way the program works. This training zone article is designed to complement these tutorials, but also offer more detail than they are able to.
In this tutorial we are going to look at how to add Moving Averages to charts, lists and Data Mining filters:
- Adding moving averages to your chart
- Adding additional moving averages to the chart
- Using the legend and seeing the analytic values
- Filtering with Moving Averages
- Golden and dead crosses
- Price crossing above or below a moving average
- Price to MA and MA to MA ratios and MA Value
- Moving Average Alarms
Adding moving averages to your chart
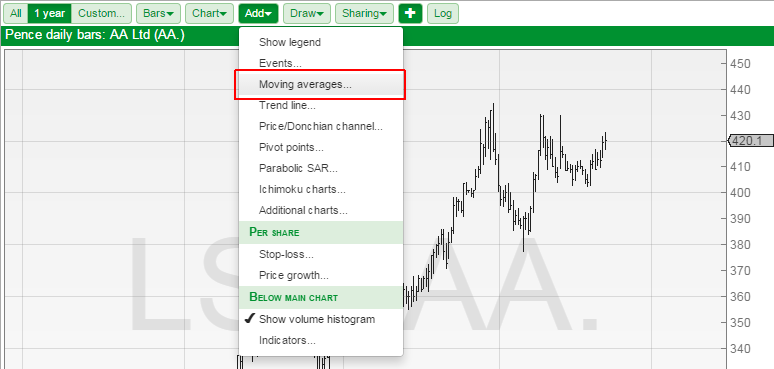
To add moving averages to your chart in ShareScope click on the pale green Add button and select Moving Averages from your menu.
The first time you select the Moving averages dialog you are presented with the Edit moving average dialog.
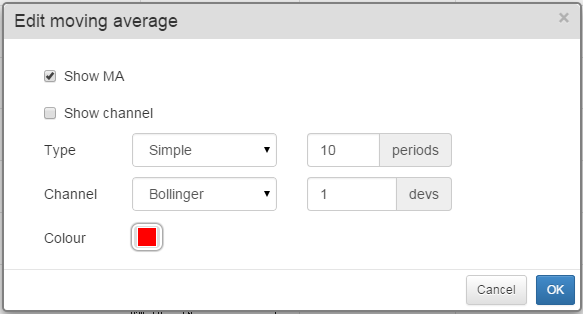
The dialog lets you toggle the Moving average and also a channel should you wish to draw one around the moving average.
It allows you to set the moving average type. The current options are:
- Simple
- Exponential
- Weighted
- Triangular
- Variable CMO
- Variable VHF
- VIDYA
You can also set the moving average period. The size of the period is determined by the bar size set on your chart. You can find out more about how to change this in the Basic Chart Design tutorial
Channels are formed by lines that are drawn above and below the moving average. There are two types of channels in ShareScope.
- Bollinger bands - Bollinger band lines are drawn a number of Standard deviations above and below the moving average line.
- Envelopes - Envelope lines are drawn a specific percentage above and below the moving average line. This means that, unlike Bollinger bands, the lines are the same as the moving average.
The Colour option sets the colour of the moving average and the colour of the Channel lines. In addition to this a lighter shade of this colour is used to fill the area between the channel lines.
Once you have set your moving average options click on OK and the moving average will be drawn on the chart.
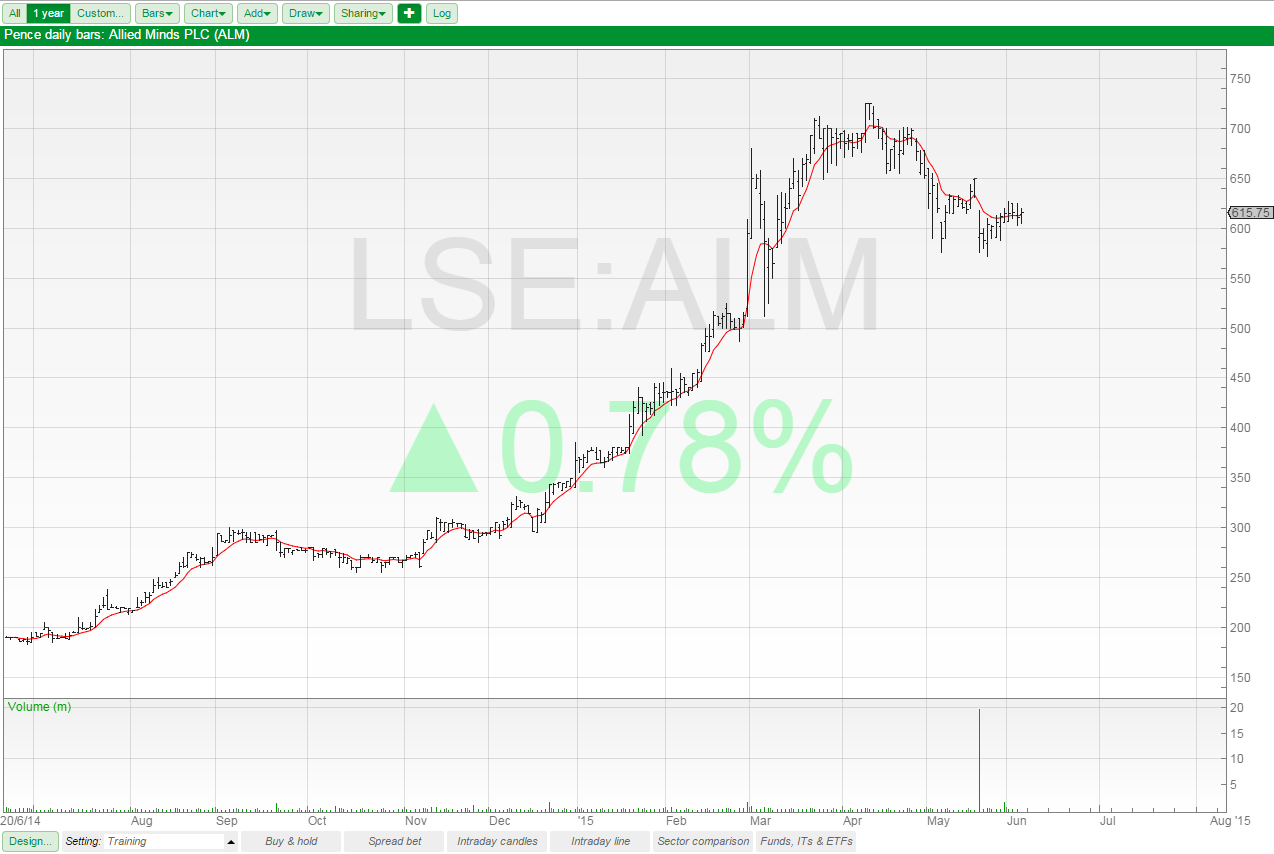
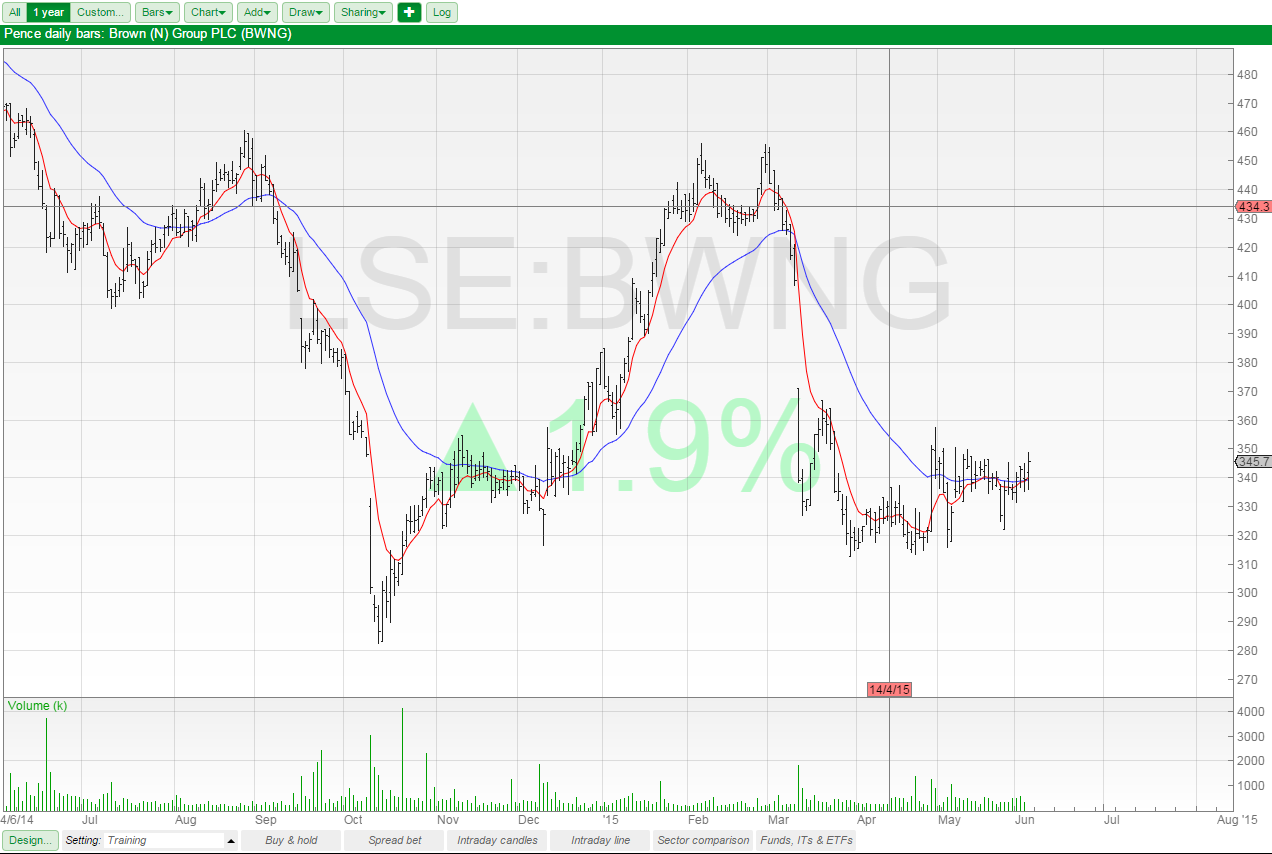
In this example I have added an 8 period exponential moving average (8 EMA) to the chart
Adding additional moving averages to the chart
If you already have one or more moving averages drawn on your chart then when you select Add -> Moving Averages the Moving averages dialog opens.
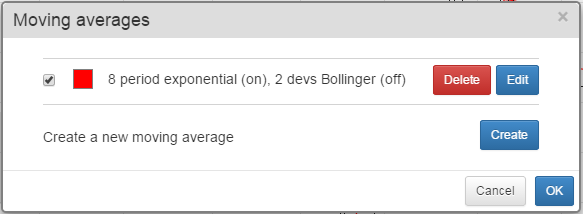
The moving average dialog lets you manage your existing moving averages or create new ones.
You can turn a moving average on and off using the tick box beside each moving average.
You can delete each moving average using the Delete button
You can Edit one of the existing moving averages. This will return you to the Edit Moving Average dialog window.
You can also Create a new moving average and then will also open the Edit Moving Average dialog window.
You can have up to 10 moving averages on each chart setting in ShareScope.
Using the legend and seeing the analytic values
On this chart I have two moving averages; a red one and a blue one. However, it isn't immediately obvious what their periods and types are.
To see this we can use the Legend. To see this select Show Legend from the top of the Add menu.
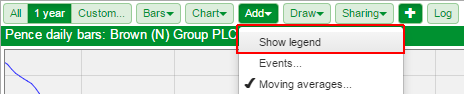
The Legend appears in a grey semitransparent window that appears at the top left of the chart and shows details of your moving averages.
If you tick Show Analytics in Design > Background then you can see the current value of the moving averages on the right-hand axis on the chart.
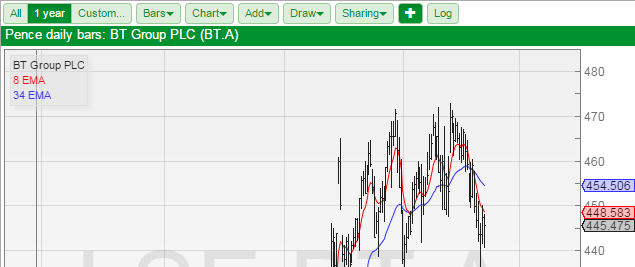
You can see from the legend that I used an 8 EMA and a 34 EMA and you can see their current values in the right-hand axis.
Filtering with Moving Averages
Note: Any of the filter criterion discussed in this section can be added as columns to a standard table. You may also wish to review the Filtering tutorial which goes into more details than will be covered here.
ShareScope has the ability to filter on:
- Golden crosses (a short period moving average crossing above a long period moving average)
- Dead crosses (a short period moving average crossing below a long period moving average)
- Price crossing above or below a moving average
- Moving average value
- Price to MA ratio - useful for looking for shares where there may be a cross in the future.
- MA to MA ratio - useful for looking for shares where there may be a cross in the future.
Using these we can also filter for moving averages rising and moving averages appearing in a specific order on the chart.
Golden and dead crosses
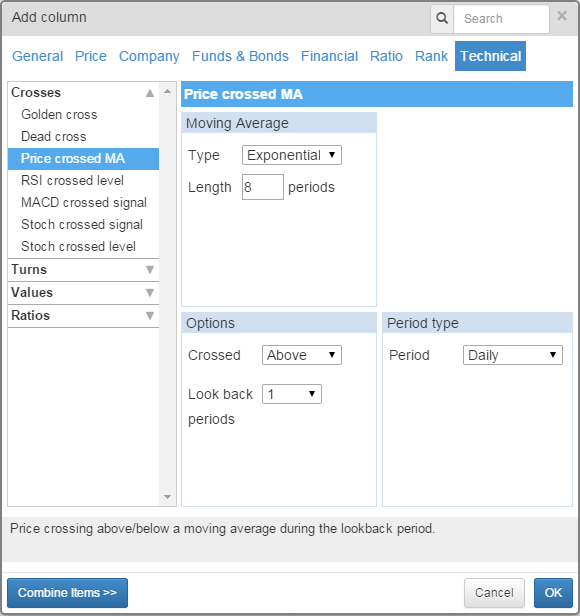
In your filter click on Add Criterion and then select Technical in the Add column dialog.
The Golden cross and Dead cross options are at the top of the dialog on the left.
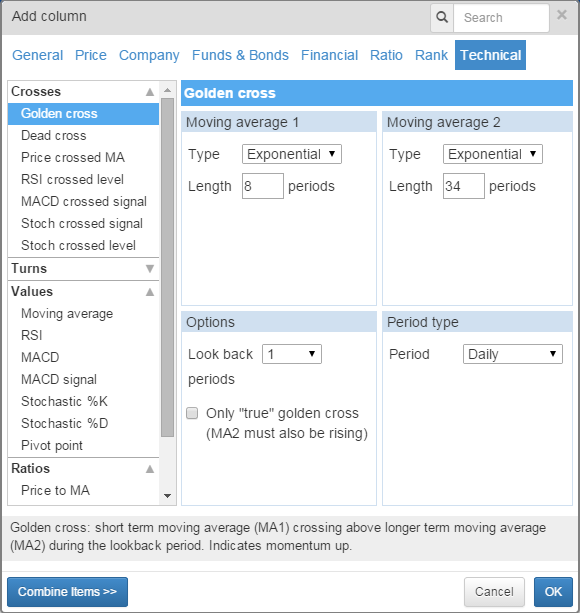
Select one these and on the right of the dialog window you will be able to set:
- The two moving average periods and types.
- The period type, which should be set to be the same as the bar size on your chart.
- A Lookback period, this determines over how many periods the program checks for a cross.
- "True" golden crosses. This requires the long period MA to be rising.
In the example above I set the parameters for an 8 EMA and a 34 EMA my period type is daily and my look back is 1.
This will show me crosses that have happened since yesterday's close.
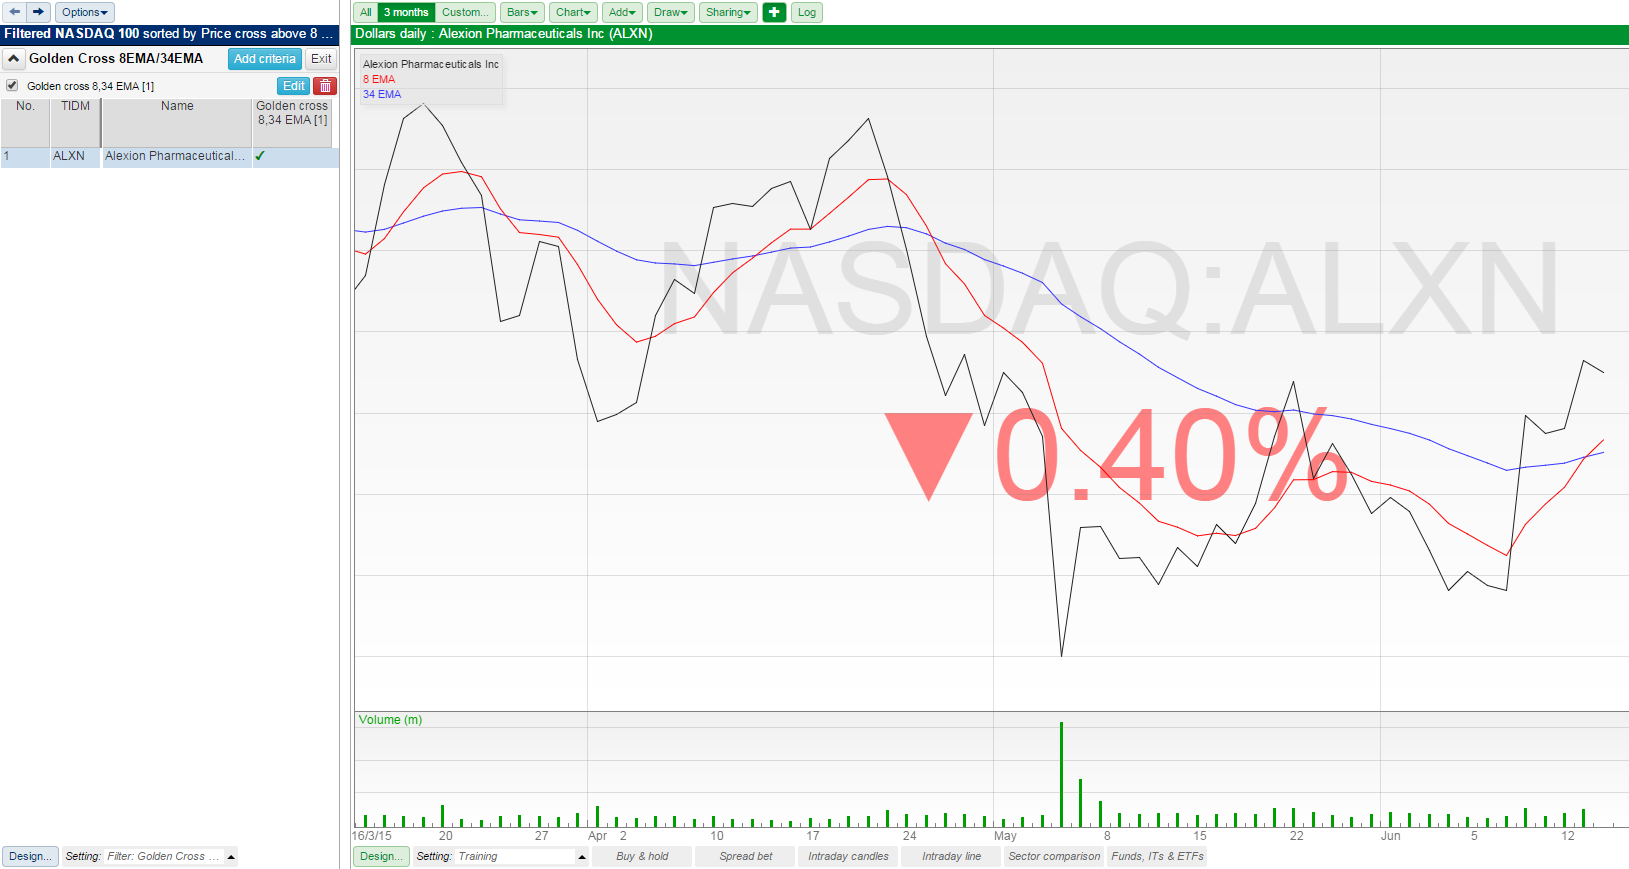
Applying the filter to the NASDAQ 100 list you can see that there is 1 share that has a cross between the 8 EMA and the 34 EMA.
You can also see the column that is created by the criterion showing a tick for the share.
The same principles that apply to a Golden cross filter can be applied to a Dead cross filter.
Price crossing above or below a moving average
Price crossed MA is a single column option that allows you to choose between Crossed Above and Crossed Below.
The options allow you to set the MA Period and type, the data period and a look back period as well.
In the above example I've used an 8 period EMA set to daily with a look back of 1 period.
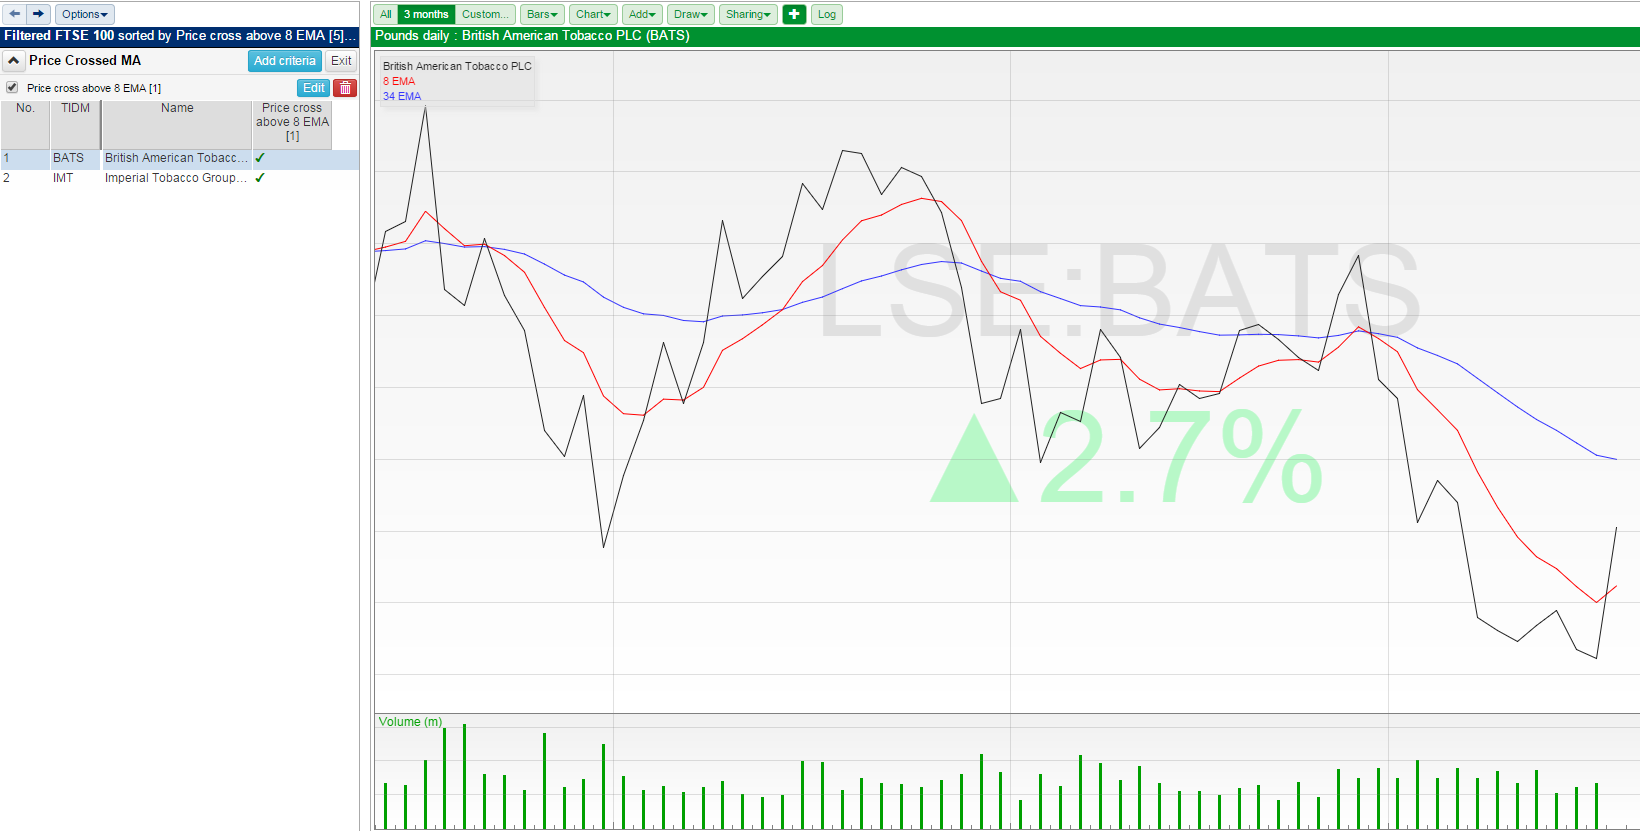
Here, on the chart for BATS, you can see that the black price line has crossed above the red 8 EMA.
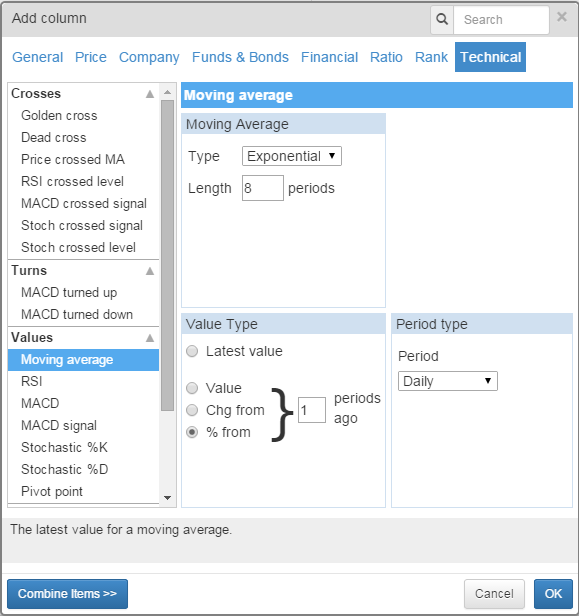
Price to MA and MA to MA ratios and MA Value
You can use the MA to MA ratios column and the MA Value column to help us find shares where the MA's are moving closer together.
If we calculate the ratio of two MAs then the value will be less than 1 if the short MA is below the long, the value will be 1 if both MAs are the same and greater than 1 if the short period MA is above the long.
So if we want to know if the 8 EMA is below the 34 EMA we can look for the Latest value of the MA to MA ratio and set the right hand value on the filter range to 0.999. We could set it to 1.000 but then our filter would also catch any shares where the EMAs have touched but not properly crossed.
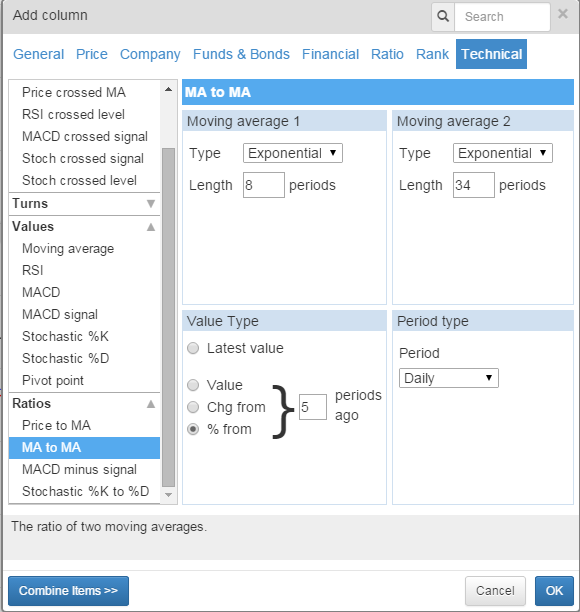
We can also use the same column options to test to see if the moving averages are moving closer together. Instead of Latest Value we use % from and set the number of periods ago.
What values we set on the criterion are going to be dictated by the relationship between the two moving averages.
As our short EMA is below the long EMA as they get closer together the ratio value will increase towards 0.999. So we want a positive percentage change.
We can also use the MA Value options to determine if a particular MA is moving in a given direction.
The options allow you to set the MA Period and type, the data period and a look back period as well.
In the above example I've used an 8 period EMA set to daily with a look back of 1 period.
If I want to make sure that the Moving Average is moving in a positive direction I set the minimum value on the criterion to 0.001
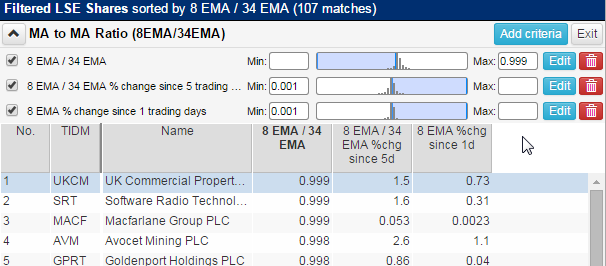
The filter will end up looking like this with the three criteria discussed above.
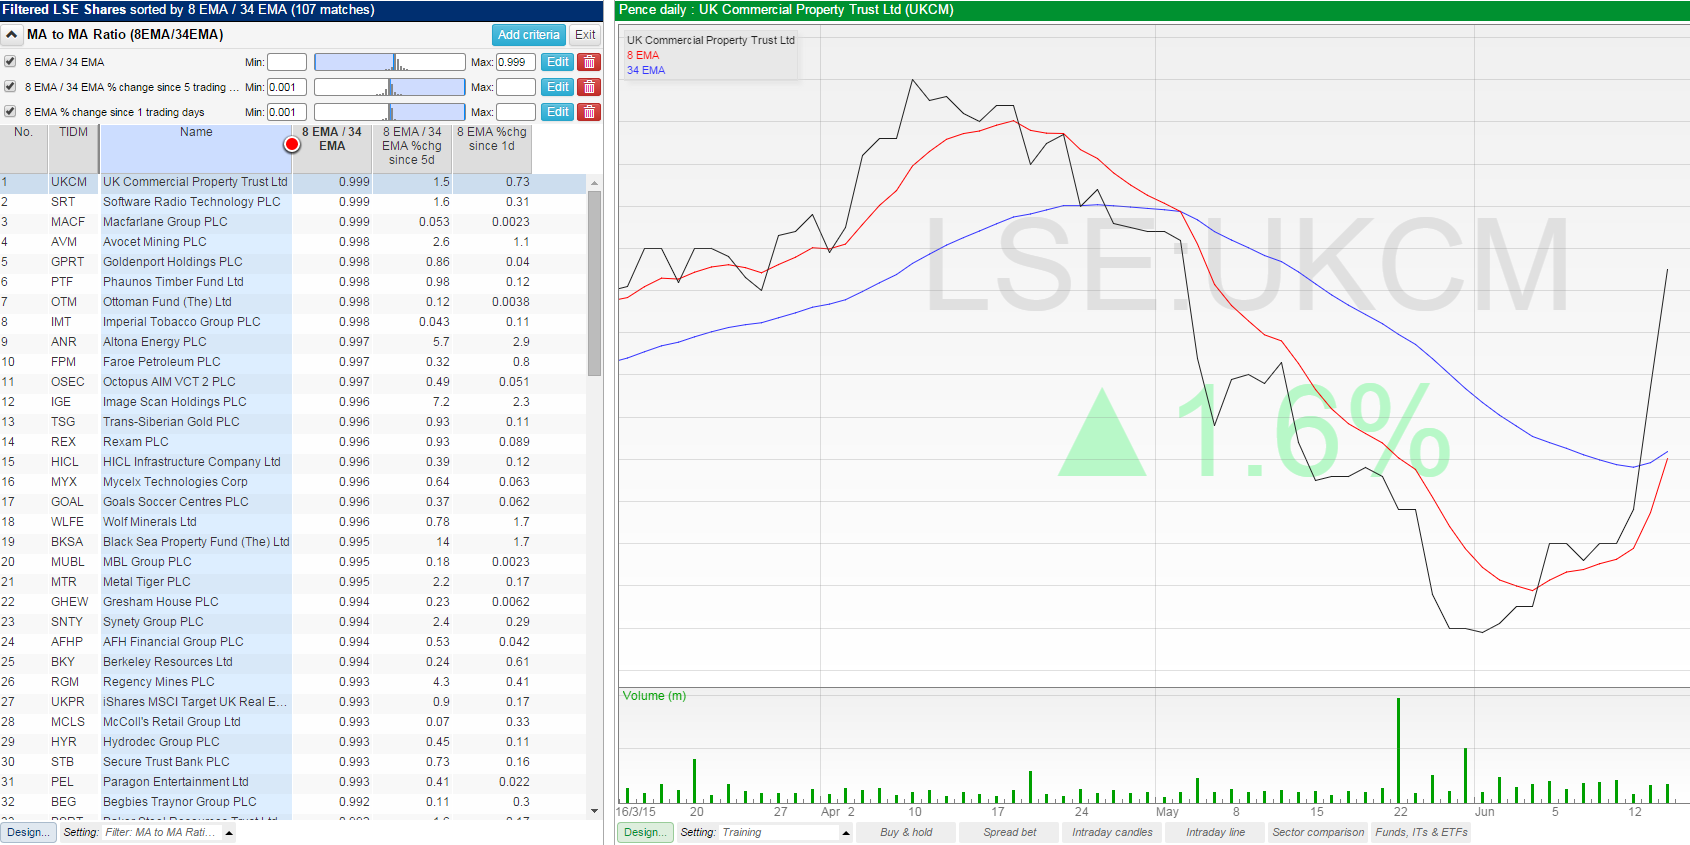
On the chart for UK Commercial Property Trust you can see the 8EMA is rising up towards the 34EMA but they have not yet crossed.
Moving Average Alarms
For more information about setting alarms in ShareScope see the Alarms tutorial.
ShareScope allows you to set Golden or Dead cross alarms on each share.
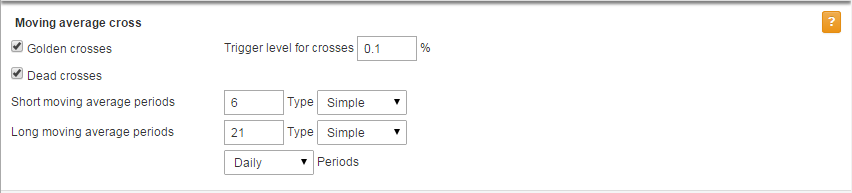
You can set the MA types, the Period size and whether the alarm is for Golden cross, Dead cross or both.
You are also able to set a trigger level. This is designed to ensure that the moving averages have cross by a significant amount and serves to stop false positive alerts being triggered.