Tutorial: Darvas Boxes
Darvas Boxes are the brainchild of Nicholas Darvas, a Hungarian-American dancer who, in 1960, popularised his "Box System" in the book "How I made $2,000,000 in the stock market".
Darvas' approach can be summarised by a quote from his book:
"I decided that if a usually inactive stock suddenly became active I would consider that unusual, and if it also advanced in price I would buy it. I would assume that somewhere behind the out-of-the-ordinary movement there was a group who had some good information. By buying the stock I would become their silent partner."
In essence, for as long as a share trades within certain bounds, Darvas says that no one is taking any particular interest in it, but the moment these bounds are broken (either upwards or downwards) people in-the-know are beginning to pay attention.
The Darvas Box tool in ShareScope Plus/Pro and SharePad attempts to automate the identification of these bounds and highlight when these bounds are broken.
To display the boxes in ShareScope Plus/Pro, right-click on a chart and select Other Main Graph Features and then Darvas Boxes. In SharePad, press the Add button on the chart then select Darvas Boxes.
Note: although Darvas Boxes can be drawn on a variety of bar sizes, the system was designed by Darvas to work on daily bars; for this reason all examples and descriptions that follow will use daily bars.
In this tutorial
How Darvas Boxes are created
First, a new high is found; normally this is a 252 day high, but the period can be set in the Darvas Box dialog.
Next, the top of the box is found. The top is generated by a four day pattern: the first day is the high found in the first step, which is followed by three days of lower highs. These can be of any value as long as they are all lower than the first high; once this pattern is found the high is used as the top of the box.
After the top of the box has been found the bottom of the box needs to be identified: starting from the low of the first bar, a pattern of three consecutive higher low is found. Once the pattern has been established the lowest low since the first high becomes the bottom of the box.
After the box has been established, a breach above (green box) or below (red box) will generate a buy or ignore signal. A breach can be made by a close price (default) or by the high/low.
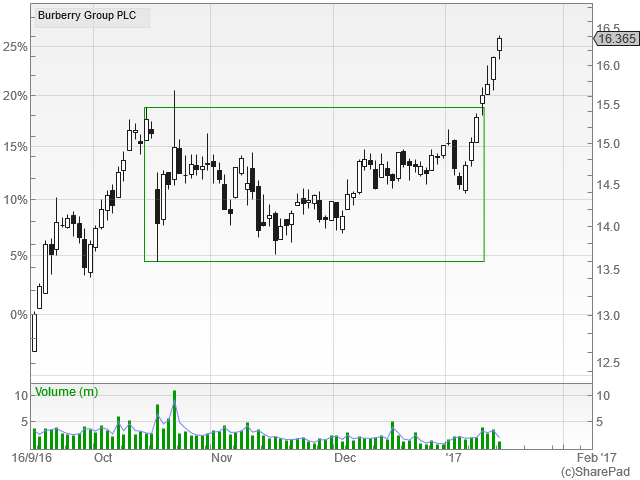
Here is an example:
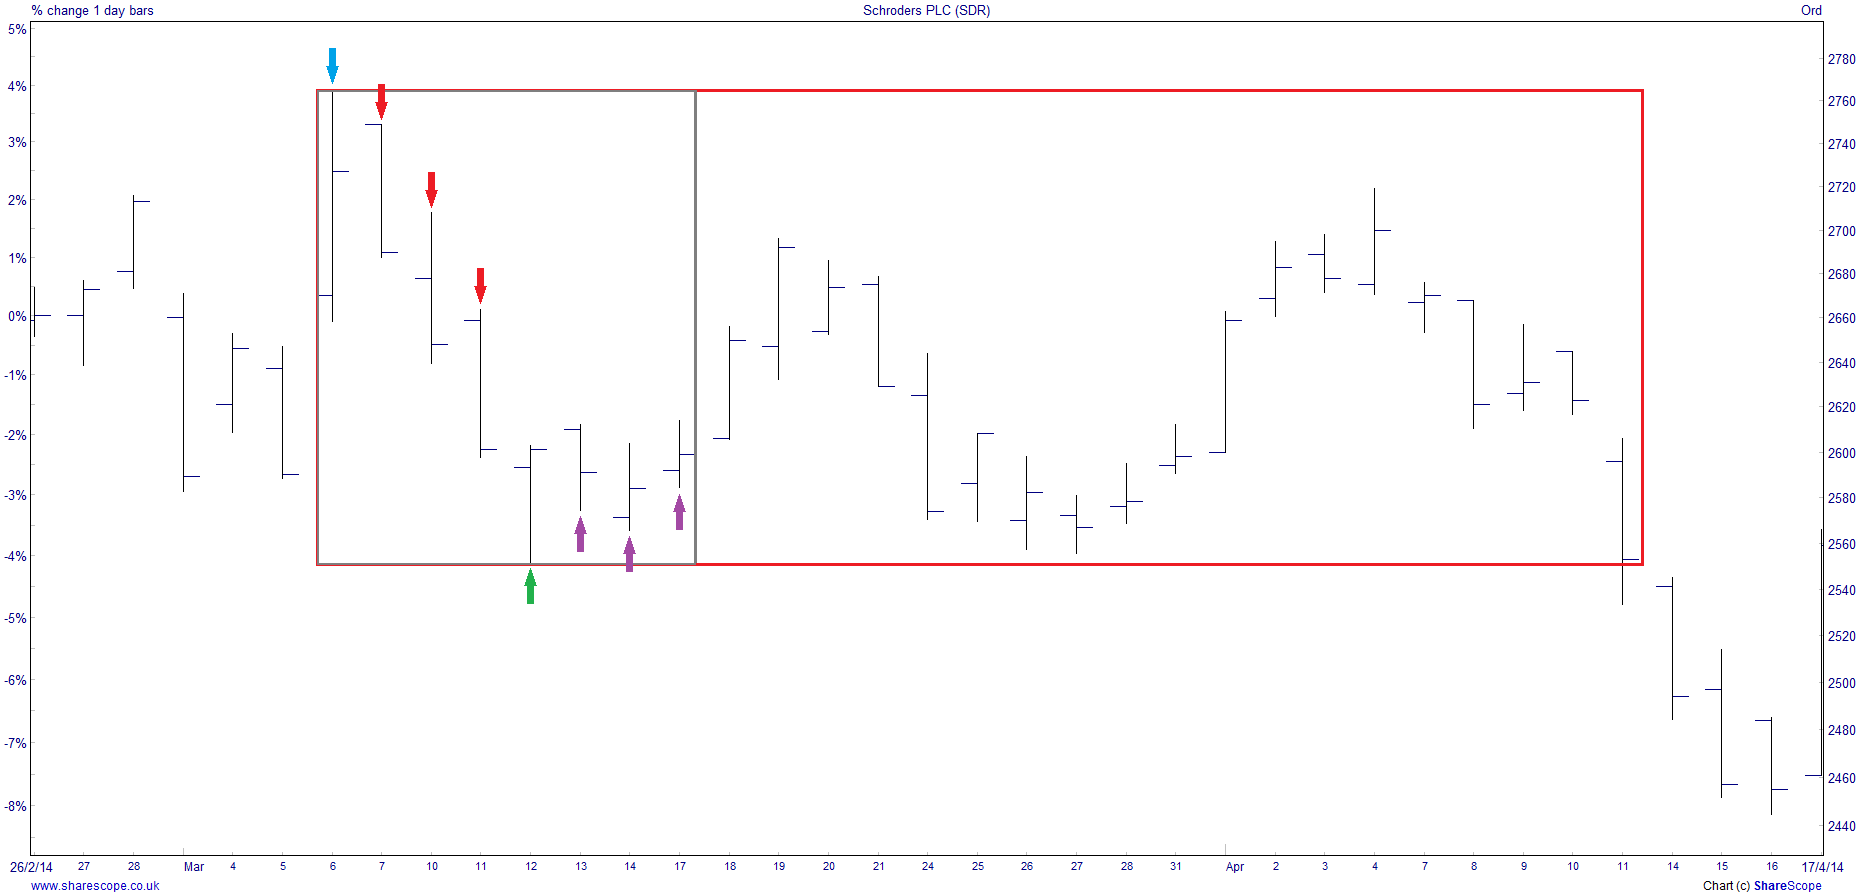
- A new highest high is found (blue arrow). This gives us both the start date and the top value of the box.
- The highs of the next 3 days (red arrows) need to be lower than the first high.
- Starting from the lowest low of the first bar (blue arrow) we look for 3 consecutive days where a new lowest low is NOT made (purple arrows). At this point the box can be drawn (grey line) with the bottom of the box equal to lowest low (green arrow)
- The end of the box is extended until it's breached. The direction of the breach will determine its final colour. In the image above the breach price is set to high/low. If it had been set to close, the box would have been extended by one day.
Darvas Box options
| New highs lookback | Sets the period over which new highs are searched for the construction of the boxes. |
| Use high/low when testing for breach | If checked a box will be considered "breached" if either the high or low moves outside the box; if unchecked the share price needs to close outside of the box in order for it to be considered "breached" |
| Up/Down colours | This sets the colours for breached boxes. A box which has been established but not breached will always be coloured grey. |
How to use Darvas Boxes
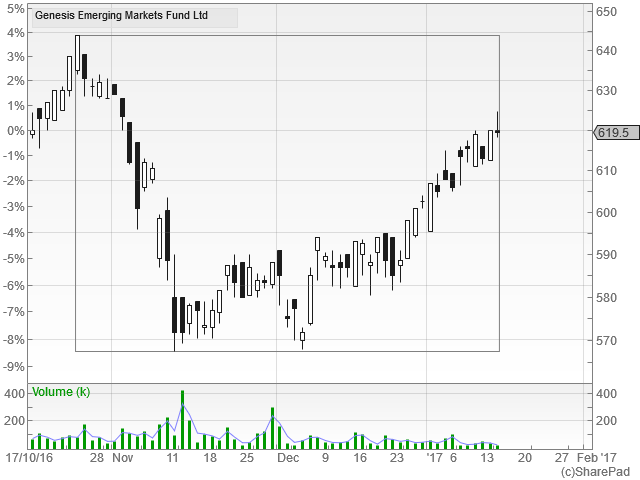
The way Darvas Boxes are used is very simple. When a share with an established (grey) box is found, it should be selected for closer inspection but no other action should be taken. For as long as the share remains within the box, it is assumed that no new information exists on the company and the price will just bounce up and down within its bounds.
The moment the price moves outside of the box, this means that a number of players in the market are privy to new information and are acting accordingly.
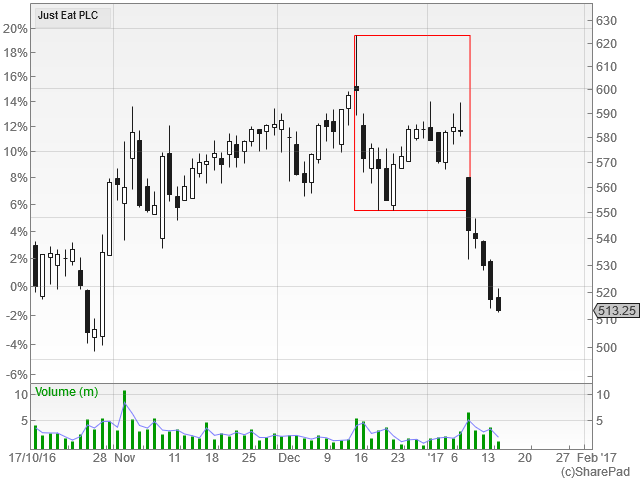
If this information is negative, the share will be sold in sufficient quantities to move the price below the box (which will turn red): this an ignore signal and a sign to remove the share from the list of potential investments.
On the other hand, if the new information is positive, those in the know will begin buying the share driving the price above the upper bound (turning the box green): this is the buy signal.
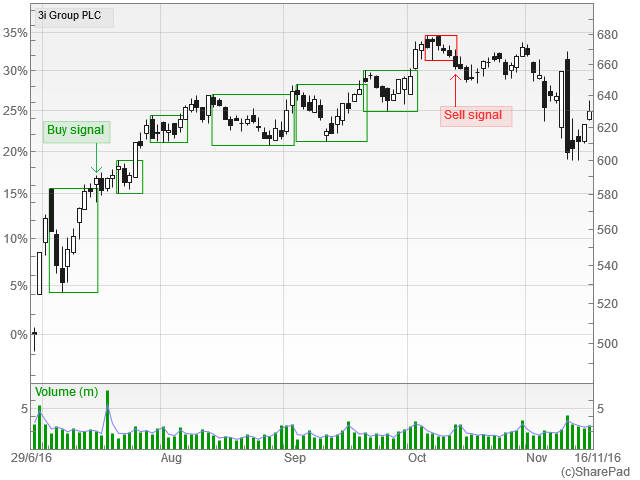
The position is then kept open until a stop-loss is breached. Darvas noticed that when a box generated a buy signal, a new box often formed above that, so he used the bottom limit of each new box as a stop-loss: as soon as the price crossed below one of them, he'd close the position.