Tutorial: Using Rank Columns to assess a stock's P/E and PEG
In this tutorial, we focus on two key accounting ratios - the P/E and PEG ratios - and demonstrate how you can use ShareScope's Rank Columns to assess a company based on these metrics.
P/E ratio
The Price-earnings ratio (P/E) is one of the most commonly used methods of assessing the "value" of a share. It provides a valuation based on the current share price compared to its earnings per share (EPS).
The P/E is calculated as follows:
Current share price / Earnings per share (EPS)
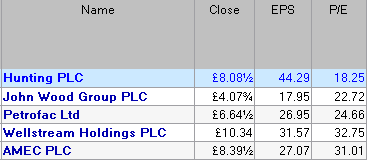
To illustrate, let's take Hunting PLC as an example. On the 15/07/2008, Hunting closed at £8.08½ with an EPS value of 44.29p.
We begin by converting the share price from pounds to pence.
If:
P/E = Current share price / Earnings per share (EPS)
Then:
P/E = 808½ / 44.29 = 18.25
Rolling P/E ratio
The value of the P/E is dependent on how the EPS is calculated. In the above example, a historical EPS is used, but the P/E can also be based on a rolling earnings figure.
A rolling figure is one that includes some of the historical results and some of the projected (forecast) results. At the start of the financial year it is made up entirely of the historical figure; as the year progresses it includes more of the forecast figure. Hunting's Rolling P/E at the time of writing is 17.64.
The benefits and drawback of this approach become obvious. On the positive side, a rolling P/E may more accurately reflect the current state of affairs with the company; but if projected earnings are incorrect or never realised then the validity of this approach comes into question. However, analysts" forecasts are updated on a regular basis for many companies.
Generally, a low P/E value suggests that a company is undervalued (cheap). That is, the price is low in comparison to its earnings. Note, however, that this may be for a reason - like the Banking and Homebuilding sectors at present.
A high P/E may suggest that a stock is overvalued but can often be a sign that investors are willing to pay more for higher growth expectations. Stocks paying high dividends often have low P/Es - the high dividend makes up for the modest growth expectations.
It is often more helpful to compare shares within the same sector, as different sectors have different P/E ratio averages. A company may have a low P/E ratio when compared to the entire market, but alongside its competitors, may prove quite the opposite.
Take a look at the following examples:
| SECTOR | P/E |
|---|---|
| Banks | 6.35 |
| Mining | 10.67 |
| Health Care Equipment and Services | 23.39 |
PEG ratio
The price/earnings growth ratio (PEG) compares a share's P/E ratio with its forecast earnings growth rate and is widely used to provide a relative value for growth stocks.
The PEG is calculated as follows:
P/E / Forecast EPS Growth
(Forecast EPS Growth is % change between the next forecast results and the latest announced results)
The rationale behind the PEG, is that the lower the value, the less you are paying for future earnings. So in theory, a stock with a high P/E, but high projected earning growth, may still represent good value.
Generally, a PEG below 1 is good, above 1 is overvalued.
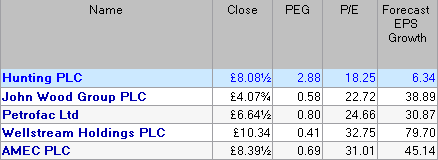
Using the Hunting example again, we take a P/E value of 18.25 and an EPS growth figure of 6.34*.
If:
PEG = P/E / Forecast EPS Growth
Then:
18.25 / 6.34 = 2.88
* Note: ShareScope calculates the PEG based on one year's forecast growth and uses the historical P/E value.
Now let's take another look at Hunting PLC.
P/E = 18.25
PEG = 2.88
An initial glace at these values would suggest that both the P/E and PEG are high.
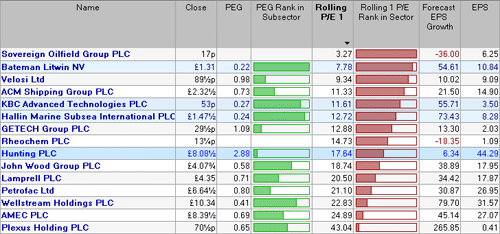
However, if we take a look at the Oil Equipment, Services and Distribution sector (above), we see that Hunting's P/E is in fact the lowest - i.e. the cheapest - amongst its FTSE 350 peers and mid-range compared to the full sector.
The PEG, though, is significantly higher which suggests that Hunting is considered to have lower growth potential than its peers. And indeed the Forecast EPS Growth column confirms this.
Rank Columns
To help you do this analysis at a glance, you can add Rank columns to List screens in ShareScope. Rank columns allow you to see how a company compares against its market, sector or subsector peers.
To add a P/E Rank column:
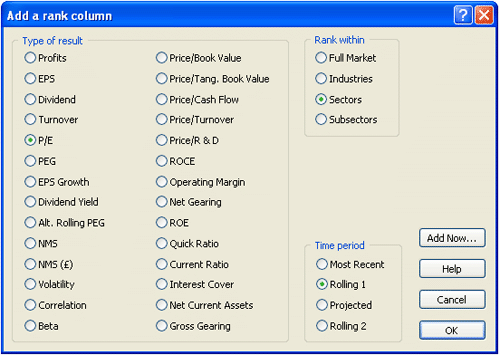
- Right-click on an existing column heading and select Add Rank Column....
- From Type of Result, select P/E.
- Choose whether you would like to rank within Full market, Industry, Sector or Subsector. In this instance we will select Sector.
- Select the time period you want to base the ranking on. In this case, we will select Rolling 1.
- Click on Add Now to add the column.
Now hover the mouse over the histogram, to display the following tooltip.
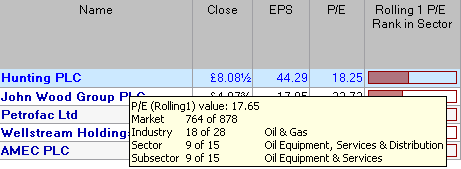
This shows the Rolling P/E value of 17.64 and confirms that Hunting ranks 9th out of 15 stocks in the full Oil Equipment, Services and Distribution sector (including Small Caps).
The Ranking values for Hunting relative to its Full Market, Industry and Subsector peers are also included.
Note: the share with the lowest P/E will be ranked 1st in the list. This is denoted by a filled bar.
Now let's repeat the process, this time for PEG.
- Right-click on an existing column heading and select Add Rank Column....
- From Type of Result, select PEG.
- Select the method of comparison. This time we select Sector.
- Select the time period you want to base the ranking on. Again we select Most Recent.
- Click on Add Now to add the column.
Note that the ranking will be based only on shares with that have a particular metric. In this case, 15 stocks have a rolling P/E figure and only 13 have a PEG value.
This shows the PEG value of 2.88 and confirms that Hunting ranks 13th out of 13 stocks in its subsector.
So whilst Hunting offers a mid-range P/E, a high PEG value may mean investors find better value in Bateman Litwin NV, KBC Advanced Technologies and Hallin Marine Subsea International PLC, all of which appear to be relatively cheap with better than average growth forecasts.
Editing Rank Columns
To change the colour and appearance of Ranking columns, right-click on the column heading and select Borders and Shading....
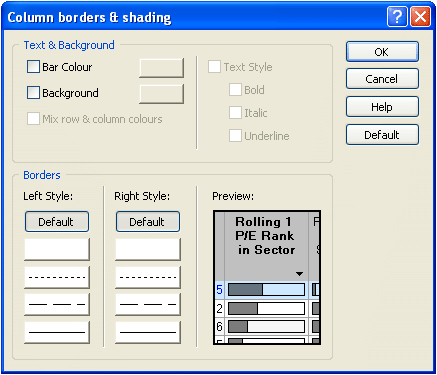
From this dialog, you can create customised text and background colours for each column and modify the type of border used.
Remember, if you have any trouble finding or using any of these features, please don't hesitate to contact our Customer Support team. They will be delighted to help.