Tutorial: Sectors
This tutorial covers sectors and the various ways you can use sector data to measure the performance of your investments and find new opportunities.
Sector Indices
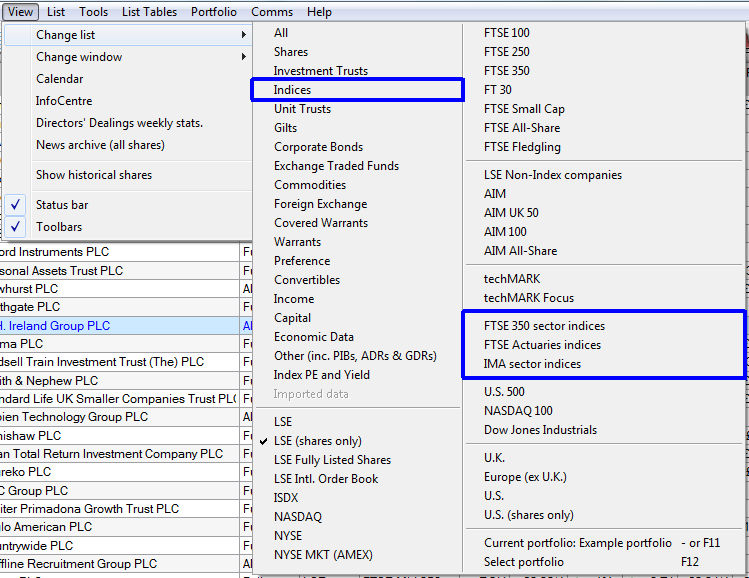
ShareScope lists three main sets of UK sector indices - the FTSE All-Share Sector Indices, the FTSE 350 Sector Indices and the FTSE 350 SuperSector Indices.
The FTSE 350 Supersector and FTSE 350 Sector Indices are calculated in real-time and are derived from the companies in the FTSE 100 and FTSE 250. Intraday data for these indices is available in Plus and Pro and the daily OHLC data is available in the 6pm update for all versions of ShareScope.
The FTSE All-Share Sector Indices are derived from the shares in the FTSE 100, FTSE 250 and FTSE Small Cap (i.e. the FTSE All-Share list). These indices are only calculated at the end of the day, after market close. Only a closing price is available and it is included in the 12pm update the next trading day.
All of these sector indices can be found in the Indices fixed list. There is also a fixed list available for the FTSE 350 Sector Indices and the FTSE All-Share Sector Indices ? note this is called the FT Actuaries list.
ShareScope also lists the IMA Sector Indices for Unit Trusts and these too have a dedicated list in ShareScope.
To view either of the FTSE sector indices lists, the IMA sector indices list or the Indices list itself, go to the View menu, select Change List and then select.
Displaying a sector's constituent shares
You can apply a sector filter in the List, Portfolio and Data Mining screens.
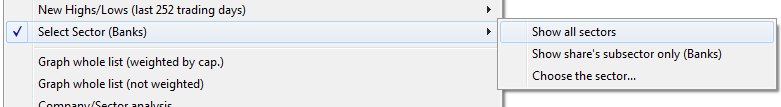
Right-click on the List screen to display the context menu. Hover the cursor over the Select sector option and a sub-menu will be revealed.
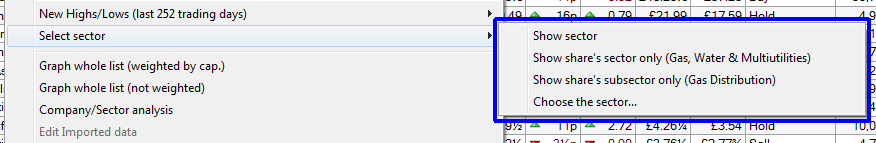
The menu contains four options.
- Show sector ? this will allow you to select the last sector you used to filter the list. In the example above the list has yet to be filtered by a sector and so no sector is shown.
- Show share's sector only - this allows you to filter the list by the sector of the currently selected share.
- Share share's subsector only - this allows you to filter the list by the subsector of the currently selected share.
- Choose the sector... - this opens a dialog that allows you to filter the list by any of the sector classifications from 'Financial/Non - Financial' down to 'Subsectors'. It also allows you to choose any of the IMA sectors for Unit Trusts and the AIC sectors for Investment Trusts.
At the bottom of the window is the drop down list from which you choose the sector, subsector etc that you wish to filter your list with.
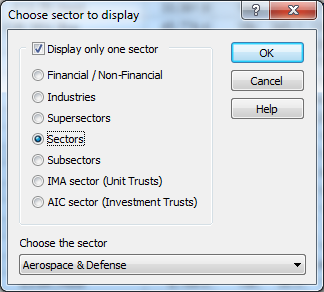
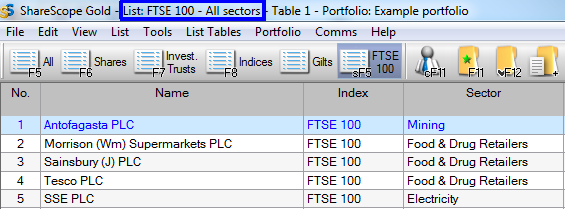
Use the options to filter the list as required. For example, to display only companies in the Banking sector, make sure the Sectors radio button is selected and then select Banks from the drop-down list underneath. Click on OK to apply.
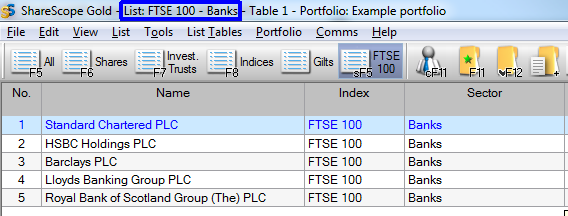
The list will be filtered immediately as shown in the example below.
By applying the sector filter to the FTSE 100 fixed list you will see the constituents of the FTSE 350 Sector Banks index. If you apply the filter to the FTSE All-Share fixed list, you will see the constituents of the FTSE All-Share Banks index.
Note: When selected, a sector filter will be applied to all lists (including portfolios and data mining filters) until deactivated.You can see on the caption bar that runs across the top of the screen in ShareScope Gold, or on the title bar of the selected window in ShareScope Plus and Pro, that the list is being filtered by the Banks sector.
To remove the filter and return to the full list, right-click on the List to display the context menu. You will see that there is a tick next to the Select sector option and the currently selected sector is shown in brackets. The sub-menu has also changed and the first option is now Show all sectors.
Select Show all sectors and the list will no longer be filtered by sector. On the Caption bar (the window title bar in Plus/Pro) you will now see All Sectors.
Adding the Select Sector toolbar buttons
There are three Select Sector toolbar buttons that you can add to your toolbars.
 Show only one sector
 Show only shares in this share's sector
Show only shares in this share's subsector
These can be added to your toolbar via the Customise Toolbars menu. More information about how to do this can be found in Tutorial 11 - Make ShareScope your own.
Note: If you hold down shift and click on the Show only one sector toolbar button the Choose sector to display dialog window will open.
Comparing a share's performance to its sector
Most investors will want to measure their investments against a benchmark such as the sector index or the market as a whole. There are a number of ways to do this in ShareScope.
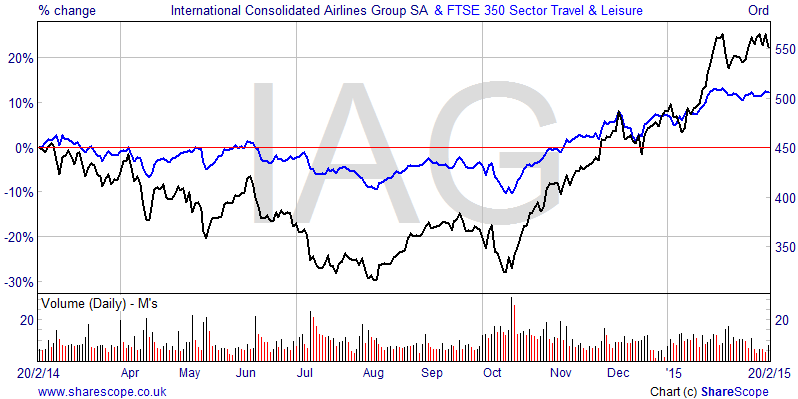
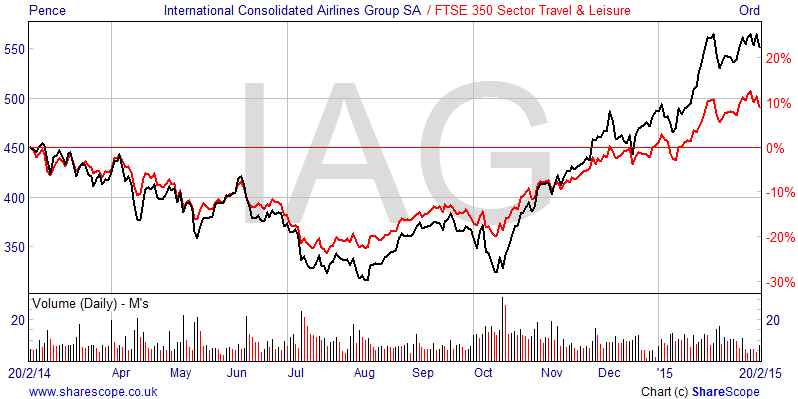
Look at the chart shown for International Consolidated Airlines Group SA (IAG): we have added its sector (Travel & Leisure) in blue. The scale is calibrated for IAG's share price. The sector has been re-based to provide a direct comparison.
In this example we can see that over the last year IAG largely under-performed its sector until the first quarter of 2015 when it started to out-perform the sector index.
To add a Share's sector to your chart:
Right click on the chart, select Additional Graphs from the context menu, click on Add and then select Add share's sector index from the menu
The left hand scale has also been changed to show a % scale. You can change this by selecting the Lines & Text tab in Graph Design.
Note: This feature always adds the FTSE 350 sector index regardless of the primary index the share is listed in.
To remove it, select the Additional Graphs option again, highlight the Additional graph on the left and click on Remove or click on Remove All.
Note: On the drop-down menu you will also find options to Add a Share or Index, Add NAV, Add a Portfolio and Add FTSE 100. Use these options to compare a share to another share or other benchmarks.
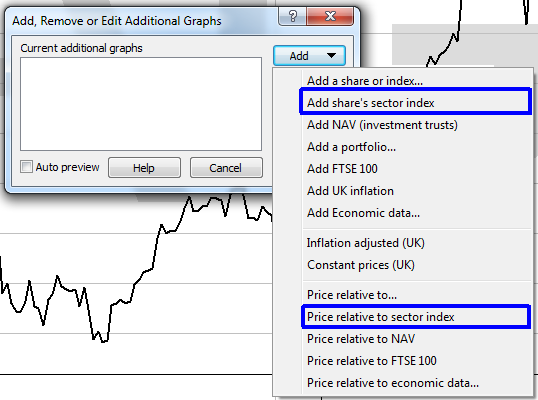
An alternative way of measuring performance against a sector is to use the Price Relative to sector index options also in the Additional Graphs dialog. This will display the relative out- or under-performance of the share against its sector index. This is expressed as a percentage and measured from the first date displayed on the chart.
To do this, select the Price relative to sector index option from the drop-down menu when clicking on Add.
You can see this on the chart:
Here, the red line represents the relative performance of IAG against the FTSE 350 Travel & Leisure sector index. We have limited the date range on this chart to show the last year of trading. So the graph tells us that, at the time of writing, over the last 12 months IAG has out-performed its sector index by around 10% so.
Note: On the drop-down menu, there are also options for Price relative to FTSE 100 and Price relative to... which enables you to compare the share against any instrument.
Identifying out-performing sectors
A key strategy used by many private and professional investors is to track the top performing sectors. Here's how you can do it in ShareScope.
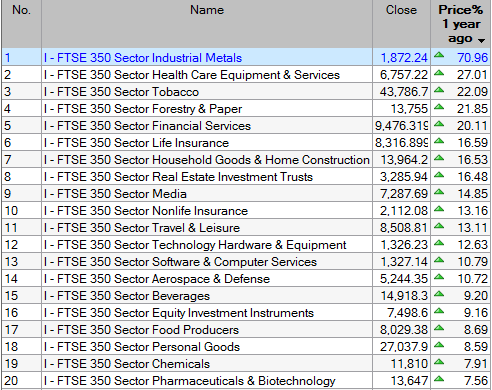
Look at the list of FTSE 350 Sector indices below. We have added a column that shows the % price change over the last year. Sorting by this column we can see that, at the time of writing, 25 sectors have outperformed the benchmarks while 13 sectors have under-performed.
Industrial Metals, Health Care Equipment & Services and Forestry & Paper are the top performers.
From this list you can ?drill down? and see the performance of each sector's constituents over the same period.
Select one of the sector indices, right click to bring up the context menu hover the mouse over Select sector and then click on Show share's sector only in the sub-menu.

In this case we selected the FTSE 350 Healthcare Equipment & Services index. When we select Show share's sector only the list is changed to show that sector's constituents.
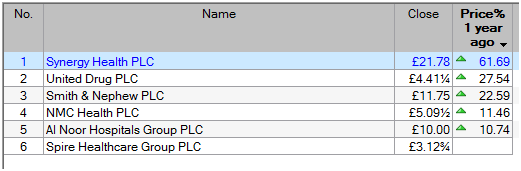
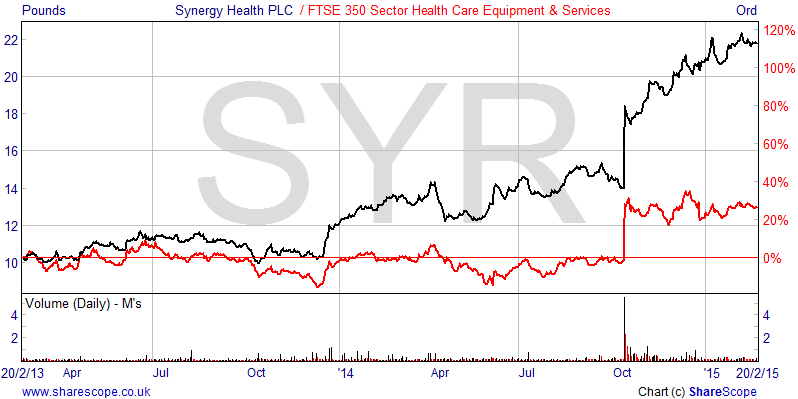
Now you can see the top performing share in that sector, which in this case is Synergy Health PLC.
If we look at the different charts for Synergy Health PLC we can see that it has recently spiked up and its price chart is significantly above the sector index.
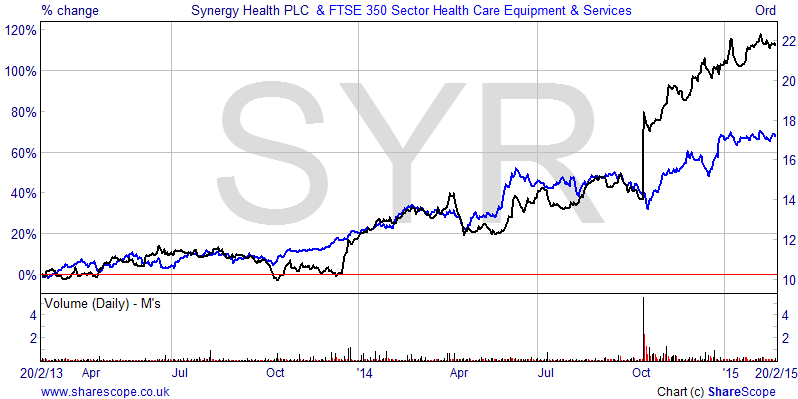
When we look at the Price relative to... chart we can see that the share is outperforming its sector by about 25%.
Bearish customers might prefer to look for the worst performing sectors and stocks for shorting opportunities. However in this case you would reverse sort the list, double left again on Price % 1 year ago, and then drill down into the constituents of the FTSE 350 Sector Oil Equipment, Services & Distribution index.
When you have finished viewing the sector's constituents right click on the list to bring up the context menu, hover the mouse over Select Sector and then choose Return to FTSE 350 Sectors list from the sub-menu.
Remember, if you have any trouble finding or using any of these features, please don't hesitate to contact our Customer Support team. They will be delighted to help.