What you need to know about working capital
One of the most off-putting things about financial matters is the amount of jargon that comes with it. There are phrases and terms which make the average lay person roll their eyes and ask themselves what on earth does that mean?
One of these terms is working capital. I must admit I don't really like the word capital. I know it can apply to different kinds of financial assets but essentially it means money. Most people understand what
money is.
This article gets back to basics and is suitable for less experienced private investors.
Phil Oakley's debut book - out now!

Phil shares his investment approach in his new book How to Pick Quality Shares. If you've enjoyed his weekly articles, newsletters and Step-by-Step Guide to Stock Analysis, this book is for you.
Share this article with your friends and colleagues:
So what is working capital?
Working capital is the money a company needs to operate on a day-to-day basis. It is an important number for investors to understand. As with most things, the best way to try and understand it is with an example.
Below is the balance sheet of Fevertree Drinks (FEVR), a maker of upmarket tonic water. I'll show you how to work out its working capital.
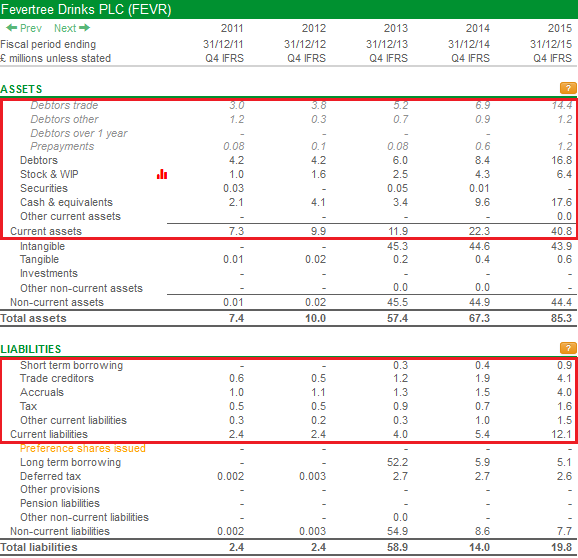
In order to sell its tonic water, the company needs to hold stock to ship out to customers. The money that it costs to make this stock is recorded on the balance sheet. You can see that Stock & WIP (Work in progress) at the end of 2015 was £6.4m.
Fevertree sells the tonic water to its customers on credit, meaning that they do not pay when they immediately receive it. At the end of 2015, Fevertree had Debtors of £16.8m. This was made up of £15.6m owed by customers and £1.2m of Prepayments. Prepayments are bills that have been paid in advance (in effect they are a credit against future expenses).
Then there was cash of £17.6m. If we add the cash to the debtors, prepayments and stocks we get a total of £40.8m of Current assets. These are assets that are cash or expected to be turned into cash within one year.
This £40.8m is tied up in the business. It isn't being used elsewhere or paid out to investors. It is a meaningful number.
Fevertree can offset this £40.8m by owing money to other parties. If we look further down its balance sheet we come to a section called Current liabilities. These represent money the company owes and which has to be paid within one year.
We can see that its suppliers (Trade creditors) were owed £4.1m. Accruals - expenses which apply to the current period but will be paid another - amount to £4.0m and £1.6m is owed to the tax authorities. If we add up the other current liabilities we get to a total of £12.1m.
If we take away the £12.1m of current liabilities from the current assets of £40.8m we get £28.7m. This is the company's working capital - an estimate of the money needed to operate on a day-to-day basis - to build and hold stock, wait for customers to settle their bills, and money on hand to pay suppliers.
Companies can have negative working capital and this occurs when the company's current liabilities are greater than its current assets (e.g. its credit terms are longer than those it extends to its customers) For example, a supermarket may pay its egg supplier on a 60 day basis but will expect to convert its stock into cash very quickly.
Why it is an important number
The more money a company has tied up in working capital, the less efficient it is likely to be. Companies with high levels of working capital can often be less profitable. By that I mean that they earn lower rates of return on the total money invested (they have a lower ROCE).
The higher working capital means a company needs to have more money invested to make each £1 of profit. Although this also depends on the amount of money invested in fixed assets such as land, building and plant and equipment as well.
Let's say two similar companies which generate the same amount of profit have different levels of working capital - one has £20m and the other £40m. Each has £60m capital employed in assets to generate its profits. The company with £40m working capital has had to employ £100m to generate its profit whereas the other company has only had to employ £80m (and therefore has a higher return).
This is a simplified example. In practice, the value of working capital may not be that useful. To compare companies - particularly those in the same sector - it can be more useful to look at working capital as a percentage of turnover.
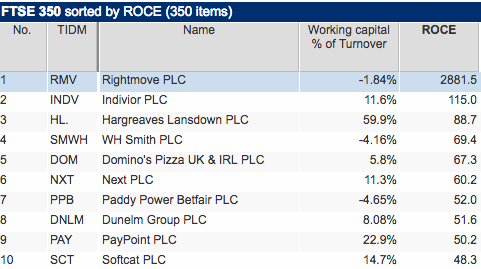
It is not surprising that some - but not all - companies with a high ROCE have low, or negative, working capital as a percentage of their turnover. See the table below for the most profitable companies in the FTSE 350.
Many companies spend a reasonable amount of time trying to minimise the amount of working capital they have. They will have sophisticated stock control systems to make sure they have just the right amount of stock and chase their customers for prompt payment.
Additionally, they can try and get better credit terms from their suppliers (i.e. take longer to pay them). This increases the value of trade creditors on the balance sheet. A company doing this is effectively getting its suppliers to finance a bit of their business for them.
Working capital and the financial analysis of companies
Working capital is an important number which can tell you some useful information when you are analysing companies.
The things that you need to keep an eye are the trends in working capital as a percentage of turnover. Turnover is the key driver of a company's stock, trade debtors and trade creditors.
SharePad calculates the following working capital ratios for you (on the Ratios tab). You can also create a financial chart for them.
- Stock as % of turnover
- Trade debtors as % of turnover
- Trade creditors as % of turnover
- Working capital as % of turnover
Let's take a closer look at Fevertree as an example of working capital analysis.
Fevertree sells bottles and cans of tonic water all over the world, so you would expect it to have some stock in its warehouses.
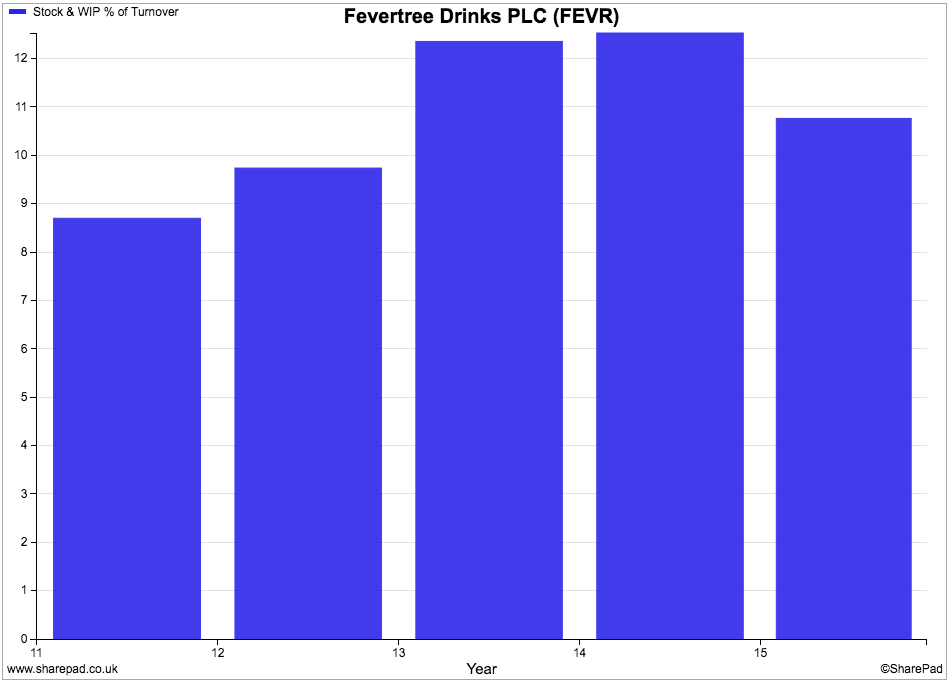
We can see here that Fevertree's stock was just over 10% of its turnover in 2015 and that the ratio has seen a reasonable decline from 2014. Back in 2011 it was just under 9% so it has increased a little since then but there have been no dramatic increases which is a good sign.
Remember, an increase in stock means more capital employed (more of a company's cash resources used up). A big increase in the amount of stock as a % of turnover can be a bad sign as it might take longer to turn it into cash. In order to do this a company might have to reduce the selling price of its stock which will lead to lower profits.
Retailers have this issue every year at Easter, Bonfire Night and Christmas when they need to avoid being left with unsold stocks of Easter eggs, fireworks and Christmas card. This stock either has to be held for another year (impossible for food items), sold off cheap or written off.
Let's turn to trade debtors as a % of turnover.
Fevertree has debtors equivalent to 24% of turnover. This is quite a big number and needs watching.
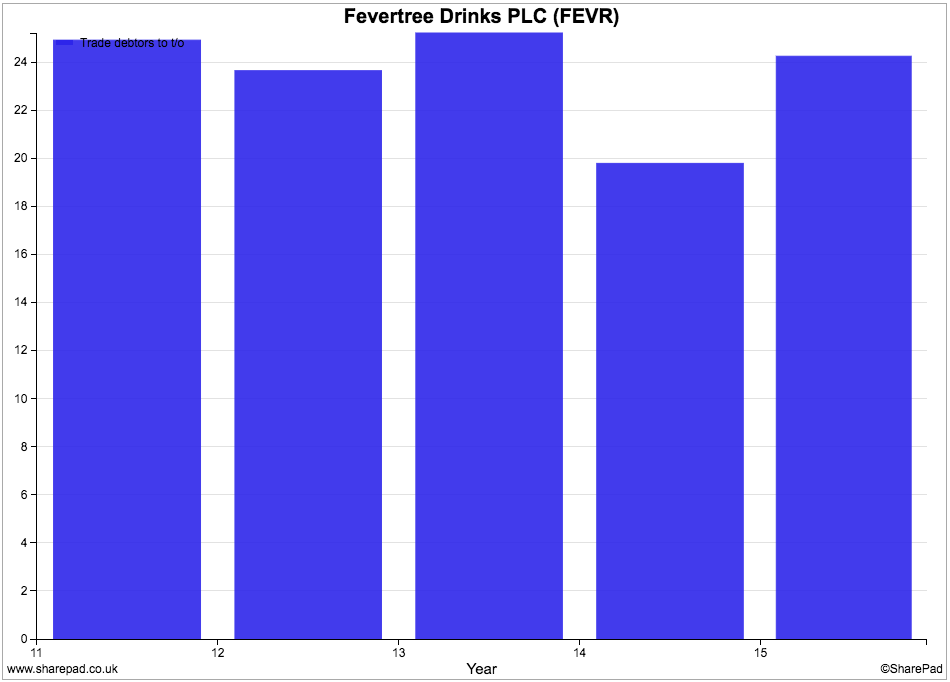
A company can offer more generous credit to its customers in order to boost sales. This is also quite normal for a young company such as Fevertree which is trying to grow quickly.
However, the more debtors a company has the bigger the possibility that some of them will go bad. Customers might not pay their bills in full or at all. These outstanding debtors will need to be written off which will reduce company profits.
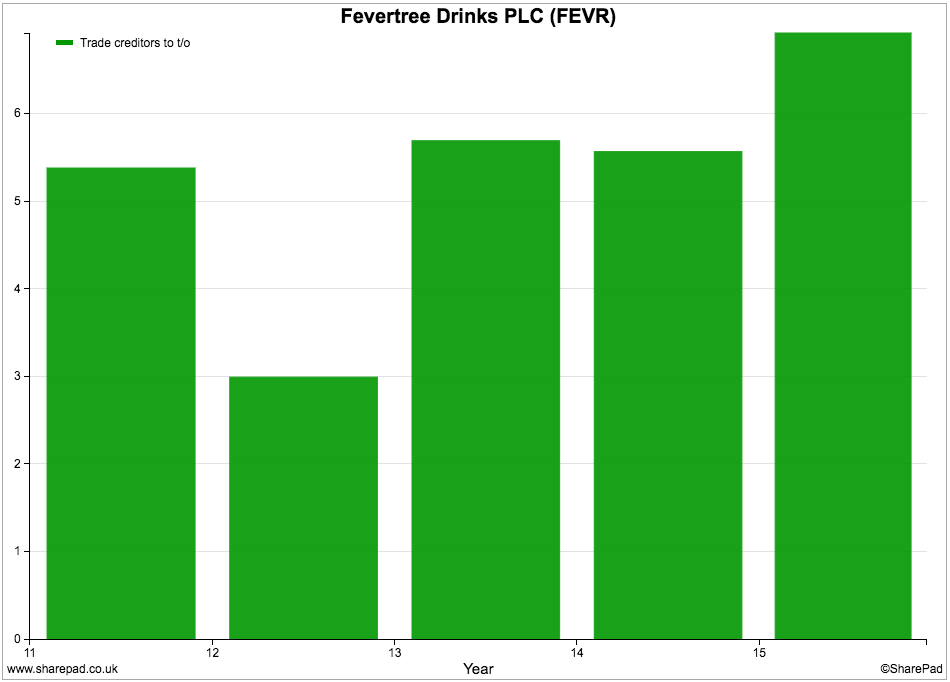
Fevertree can try and offset the working capital tied up in stocks and debtors by taking longer to pay its trade creditors and increasing them as a % of turnover.
As we can see in the chart below, this ratio has remained quite stable but did increase in 2015, suggesting that Fevertree might have gained some bargaining power with its suppliers to help finance its business.
The working capital cycle
The absolute level of working capital in a business is not the most important thing to consider. What is more important is the working capital cycle - how quickly cash flows through the business. The faster the cycle, the more efficient the business.
The working capital cycle looks how long it takes a company to sell its stock (stock days), collect its outstanding debtors (debtors days) and pay its creditors (creditor days). SharePad calculates these for you.
If we add all three components we get the working capital cycle in days. The smaller this number, the better. As explained earlier, a company will try and offset the days of turnover tied up in stock and debtors by increasing its trade creditors.
Working capital cycle (days) = Stock days + debtor days - creditor days
I have created a custom results table in SharePad to show you Fevertree's results. Its working capital days are broadly same as they were back in 2011 at around 103. Stock days have increased but this has been offset by an increase in creditor days.

Some things to consider
Comparing working capital as a % of turnover and calculating working capital days is a useful thing to do and something that makes you better informed. However, the ratios need to be interpreted with care.
The amounts of stock, debtors and creditors are all based on values at the end of the year whereas turnover is generated throughout the year. Year end balance sheet values might not be representative of levels of working capital throughout the year.
As I mentioned earlier, the quality of stock and debtors can also be an issue which can lead to reductions in profits.
Working capital and free cash flow
The changes in working capital from one year to a next can have a big impact on a company's trading (operating) cash flow. In turn, this can alter the amount of free cash flow a company produces.
The table below summarises what happens to a company's free cash flow (FCF) depending on the change in working capital item from year to year.
| Working Capital item | Increase | Decrease |
|---|---|---|
| Stocks | FCF down | FCF up |
| Trade debtors | FCF down | FCF up |
| Trade creditors | FCF up | FCF down |
In other words, a company can boost its free cash flow by making the following improvements to working capital:
- Stock decrease - less money is tied up in them
- Trade debtors decrease - customers pay their bills faster
- Trade creditors increase - the company takes longer to pay its suppliers
Free cash flow has rightly become an important and increasingly popular way of weighing up a company and the value of its shares. That said, you need to be careful that you are not basing your free cash flow analysis on one year's cash flow performance which has received a boost from a reduction in working capital.
This is because a boost is often a one-off and temporary event. It is not a permanent boost in free cash flow. Unless a company can squeeze working capital again next year, this cash flow benefit will not occur and FCF could actually fall.
Thinking that a company's free cash flow is impressive and that the shares might be cheap could be a mistake.
Have a look at bus and train company Stagecoach between 2015 and 2016 as an example of this.
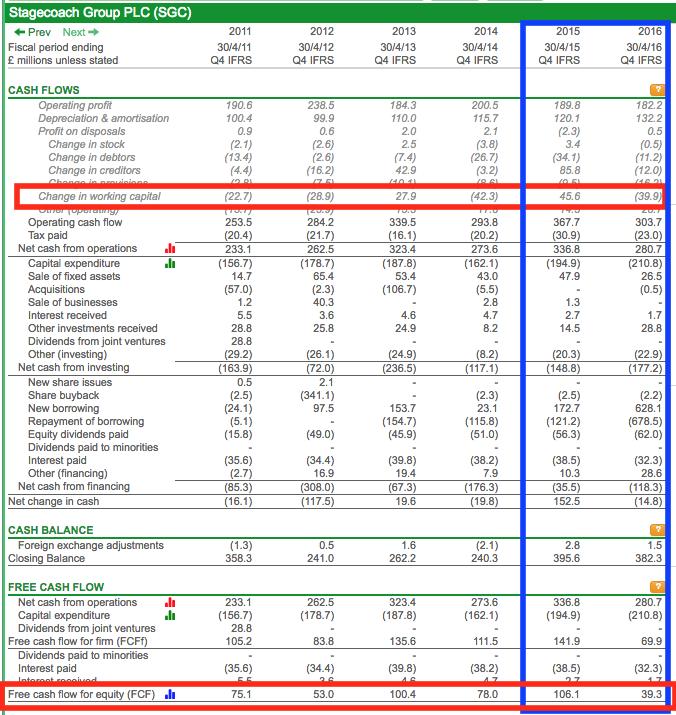
In 2015 there was a £45.6m inflow of cash from changes in working capital which was a large chunk of the £106.1m in free cash flow produced. Moving on a year, working capital changes lead to £39.9m of cash flowing out of the business - an £85.7m negative swing - and free cash flow fell dramatically.
This is why I am more inclined to weigh up a company based on an estimate of its cash profits (which ignores changes in working capital) rather than free cash flow per share. To read more on why I think this, click here.
To sum up
- Working capital is the amount of cash a company needs to manage its short-term commitments (stock, debtors and creditors). The lower the better.
- The less cash tied up as working capital, the more capital the company can dedicate to generating profit and thus higher returns (ROCE).
- Increases in stock and/or debtors are higher risk and can lead to lower profits.
- Trends in working capital as a percentage of turnover can give you insights into how a company is performing and also helps you compare companies (particularly sector peers).
- The working capital cycle tells you how quickly the company turns over this cash and is a sign of efficiency. The quicker the better.
- Changes to working capital can significantly affect free cash flow - a popular and important measure of company performance.
- An improvement to working capital (e.g. a reduction in debtors) which increases free cash flow will probably be a one-off event because you can only squeeze stock, debtors and creditors so far. Free cash flow may fall the following year.
If you have found this article of interest, please feel free to share it with your friends and colleagues:
We welcome suggestions for future articles - please email me at analysis@sharescope.co.uk. You can also follow me on Twitter @PhilJOakley. If you'd like to know when a new article or chapter for the Step-by-Step Guide is published, send us your email address using the form at the top of the page. You don't need to be a subscriber.
This article is for educational purposes only. It is not a recommendation to buy or sell shares or other investments. Do your own research before buying or selling any investment or seek professional financial advice.