The case for enterprise valuations
A couple of weeks ago I wrote about the subject of PE ratios (click here to read the article) and the ins and outs of using them to value companies. One of the main drawbacks of PE ratios - and any valuation using a share price - is that it can be distorted by the way a company is financed and perhaps give misleading signals as to how cheap or expensive a company's shares actually are.
Enterprise valuations (EVs for short) get round this problem. In this article, I am going to discuss the main types of EVs investors can use and how to interpret them.
If you are a SharePad user, you'll have access to all the values and ratios discussed in this article.
Phil Oakley's debut book - out now!

Phil shares his investment approach in his new book How to Pick Quality Shares. If you've enjoyed his weekly articles, newsletters and Step-by-Step Guide to Stock Analysis, this book is for you.
Share this article with your friends and colleagues:
What are enterprise valuations?
An enterprise value tell you how much a buyer would have to pay to buy a company as a whole, not just the equity part of it. To calculate a company's EV you need the following bits of financial information about a company:
- Its market capitalisation (the market value of its equity) - this is simply the current number of shares in issue multiplied by the current share price.
- Total borrowings - this can be found on a company's balance sheet.
- The total value of cash and cash equivalents. Again this can be found on the balance sheet.
- The value of any preferred equity shares (preference shares). This can be a balance sheet value or a market value of the preference shares traded on a stock exchange.
- The value of any pension fund deficit. These are real, debt-like liabilities that any buyer would have to take on or pay off. Again, this number can be found on a balance sheet.
- Minority interests - the amount of equity that does not belong to the company's shareholders. Minority interests occur when a company owns more than 50% but less than 100% of a business.
EVs can be seen as a total market valuation of a company's assets.
Calculating Booker Group's EV (£m)
Here's how Booker Group's EV is calculated.
| Mkt Capitalisation (1782.5m x 200p) | £3,565m |
| Add: Total Borrowings | £0m |
| Take away: Cash & cash equivalents | -£161m |
| Add: Preferred Equity | £0m |
| Add: Pension fund deficit | £47m |
| Add: Minority interests | £0m |
| Total Enterprise Value (EV) | £3,451m |
|---|
If you are a SharePad subscriber then you don't have to worry about calculating EVs as the software does this for you.
Anything added to a company's market capitalisation in the calculation of EV is effectively something that else that has to be bought or a liability that has to be taken on. The cash balance is deducted as it is assumed that the company can use this to pay some of its liabilities. This then lowers the purchase price or EV for a buyer.
How to use EVs
The important thing to remember when you are using multiples to look at the value of companies is that the numerators and denominators of them must match up.
So price multiples which concern the equity of a company must be matched with corresponding returns:
| PE | Price | EPS (post-tax profit per share) |
| P/FCF | Price | Free cash flow (for equity) |
| P/NAV | Price | Book value of equity (net asset value) |
The same applies for EV multiples. Because EVs are all about the market values of equity and debt they must also be matched with the corresponding returns: the sales, pre-interest profits and free cash flows that accrue to both lenders and shareholders.
If you don't match up the right numbers then you are effectively comparing apples with oranges. For example price/EBITDA per share or EV/net profit.
Taking this on board, it is possible to calculate the following EV multiples:
- EV/EBITDA
- EV/EBIT
- EV/FCFf
- EV/NOPAT (Debt-adjusted PE)
- EV/Sales
- EV/Capital Employed
- Earnings power value (EPV)/EV
SharePad can do all of these calculations for you. Just as with price multiples, the lower the number, the cheaper the valuation of a business and the cheaper its shares are deemed to be.
As with price multiples, they can be calculated on a trailing/historic basis using reported numbers or on a forecast basis (where forecast values are available). This article uses reported numbers.
Always remember that low valuations can often be a sign of a poor quality business and do not make very good long-term investments. Conversely, higher valuations associated with high quality businesses which have good growth prospects can be very good investments.
Let's take a look at these EV multiples in turn by using them to analyse the value of the UK food retailing sector.
If you are a less-experienced investor, don't worry if you get a bit bogged down. Pick one or two of these ratios and try using them alongside the usual price multiples. It's all about gradually expanding your knowledge and analytical toolkit.
EVs in practice - the UK food retailing sector
The table below shows a number of EV multiples applied to the UK food retailing sector.

I've calculated these in SharePad using the Combined item feature in the Add column dialog.
EV/EBITDA
This is by far the most popular and widely used EV multiple.
EBITDA (earnings before interest, tax, depreciation and amortisation) is seen as a proxy for a company's pre-interest, pre-tax gross operating cash flow. It is favoured by some analysts and investors over measures such as the PE ratio because:
- EVs are better than PEs for comparing companies with different amounts of debt and cash. (This argument applies for all EV multiples). EBITDA is a pre-interest figure - unlike EPS - so looks at a number that can be claimed in part by a company's lenders and shareholders.
- Different companies have different depreciation, amortisation and tax - all of which distort EPS numbers. EBITDA gets rid of these distortions.
- Because of the deductions, EPS will be a negative number more often than EBITDA. EV/EBITDA therefore gives some way of valuing a loss-making company and comparing it with others.
Detractors of EV/EBITDA (including me) would make the following points:
- EBITDA is not a reliable measure of a company's operating cash flow. This is especially true for a fast-growing company which requires lots of working capital cash outflows. EBITDA will also not take into account companies making large top up pension deficit payments.
- EBITDA does not take into account the amount of money needed to replace a company's assets. This is especially true for capital intensive sectors such as food retail, pubs, manufacturing and mining where assets need to be replaced (replacement capital expenditure or capex) in order to maintain sales and profits.
- EBITDA also ignores differences in accounting policies such as revenue recognition and the the capitalisation of costs. For example, software companies can choose either to fully expense or to capitalise and amortise development costs. A company capitalising and amortising development costs would have a higher EBITDA than one which fully expensed them against revenues even if they had spent the same amount of cash.
So unless a company has no replacement capex, no tax bill, no pension deficit or no working capital requirements. EBITDA is not a good proxy for cash flow that can be paid to investors which makes EV/EBITDA a poor valuation method in my view.
But this is how it might be interpreted for the UK food retailing sector:
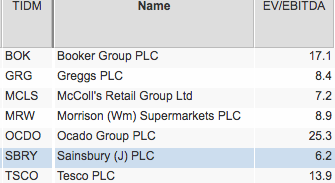
Sainsbury's would be seen as the cheapest company on this measure trading on just 6.2 times its last annual EBITDA with Ocado the most expensive on 25.3 times.
6.2 times is a very low multiple and may be seen as a sign of a very cheap business or one that is facing a number of challenges. 25.3 is expensive and requires many years of strong profits growth to justify it.
EV/EBIT
EBIT (earnings before interest and tax), also known as operating/trading profit, is probably the best measure of profits for a company as a whole. It is subject to many of the same criticisms as EBITDA above but at least a deduction for the replacement of fixed assets in the form of depreciation has been made.
A thorough analyst or investor will spend some time looking at the quality of a company's accounting on issues such as working capital, depreciation, pension funds and revenue and cost recognition. This requires quite advanced financial analysis but if the analyst is satisfied that there is nothing dodgy going on then EV/EBIT can be a reasonable basis for valuing a company in steady state (ignoring the costs of growing the business)
Again low EV/EBIT numbers can be seen as a sign of cheapness and vice versa. EV/EBIT can also be turned upside down (EBIT/EV) to get something known as an EBIT yield. Expressed as a percentage, the higher the EBIT yield, the better value the share.
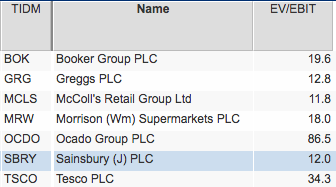
As with EV/EBITDA, Sainsbury's looks cheap on this measure but McColl's looks slightly cheaper. Ocado has a very high valuation of 86.5 times or a very low EBIT yield of just 1.1%. Again, this is telling us that very high rates of profit growth are needed to justify its current EV.
Generally speaking, if you can pick up a decent quality business with an EV/EBIT multiple of less than 10 and where there is the prospect of growth you stand a reasonable chance of making money.
I have bought businesses with EV/EBIT multiples as high as 20 providing the quality of the company is very high and it has a good chance of growing strongly for many years to come. Of course, I'd rather pay a lot less.
EV/FCFf
Free cash flow for the firm (FCFf) measures the amount of surplus cash flow left over to pay lenders and shareholders after assets have been replaced, new assets have been invested to grow the business (capex) and tax has been paid.
Providing capex levels are not too low (considerably less than replacement needs or depreciation) and the tax expense is not too high or low then FCFf is a good number to value companies. Professional investors will often adjust the capex number for maintenance or "stay in business" capex to get a better feel for underlying free cash flow generation. SharePad deducts all capex when calculating FCFf.
EV/FCFf or 10 or less can be a sign of very cheap share. Morrisons looks interesting from this point of view. McColl's which looked relatively cheap to its peers on EV/EBIT looks less attractive on this measure.
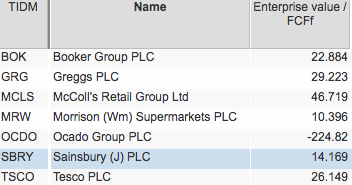
Closer inspection of McColl's reveals that this is due to working capital cash outflows. An investor would need to reassure themselves that these outflows were temporary. The same approach applies to companies whose FCFf has been boosted by temporary inflows of working capital.
EV/NOPAT (Debt-adjusted PE)
NOPAT stands for Net operating profit after tax (or taxed operating profits). We call this Debt-adjusted PE in SharePad. It is very similar to EV/FCFf but with a couple of differences.
- NOPAT only includes a deduction for depreciation (replacement capex) whereas FCFf deducts all capex. Where capex is considerably more than depreciation, a company will have a lower debt-adjusted PE than EV/FCFf multiple.
- NOPAT makes no adjustments for working capital inflows or outflows whereas FCFf does. In some ways this is sensible if you want to look at the value of a business in steady state before growth is taken into account. EV/FCFf can be lower than debt-adjusted PE if there is a substantial working capital inflow (due to reducing stock or paying bills later).
In my view, companies should not be penalised heavily for working capital outflows used to fund future growth. If there are consistently high outflows - faster than the growth in sales - then this may be a sign of profit manipulation. Also, working capital inflows such as those from squeezing suppliers for longer payment terms are rarely a permanent source of value which can be mistakenly ignored if using FCFF.
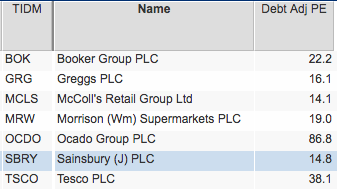
I like debt-adjusted PE or EV/NOPAT as a way of weighing up a company's value. If I can reassure myself that the company's accounting is sound and profits are capable of growing then it is something I tend to use a lot in my own investing toolkit.
Ideally I look to see if I can buy high quality, growing companies for less than 20 times debt adjusted PE. That's not very easy in current stock markets.
The food retail sector is not looking very attractive on this measure with the possible exceptions of McColl's. That said, food retail is fiercely competitive with low profit margins and poor growth prospects. McColl's may not be a cheap share for this reason.
EV/Sales
Price to sales is commonly used to weigh up the value of loss-making companies or those with cyclically-depressed profits in a recession. It was a measure that was used extensively by technology analysts during the dot-com boom of the late 1990s.
As with all price-based multiples, a price to sales multiple ignores companies which are financed by significant amounts of debt. Some of the sales will be needed to pay interest on debts. EV/Sales gets round this problem.
When I worked in the City I occasionally used to come across analyst reports comparing the EV/Sales ratio with a company's profit margins. Broadly speaking, the argument was that there was a correlation between the two numbers - higher margins justified higher EV/Sales multiples and vice versa.
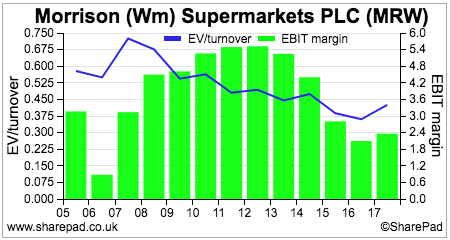
For example, an ex-colleague of mine used to argue that a company with a 10% EBIT margin should trade on a EV/Sales multiple of 1.0. The rough and ready rule was that you divided the EBIT margin by 10 to get the implied EV/Sales multiple. So if a company had an EBIT margin of 5% it should trade on an EV/Sales multiple of 0.5 times. If it was less than that the shares might be undervalued.
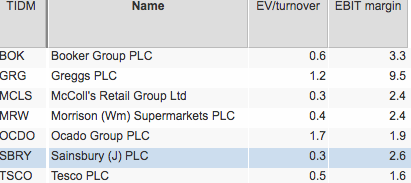
On that basis, supermarket shares are no bargains. Perhaps, Sainsbury's with an EV/Sales of 0.3 and a profit margin of 2.6% is worth considering.
I'm not a fan of sales-based valuations. Profits and cash flows are what matters when the valuation of a company is concerned.
As for the EV/Sales versus profit margin argument. I can see where it is coming from, but would say that profit margins are not the sole determinant of company valuation. Crucially, they ignore the amount of money that has been spent to produce the margins.
EV/Capital Employed
This is the debt-adjusted version of P/NAV (aka price to book value). Here the company's EV is compared with all the money invested (capital employed) in the business.
You can adjust these ratios to take into account of off-balance sheet leases in SharePad if you want to. I have not in this example just to keep things simple.
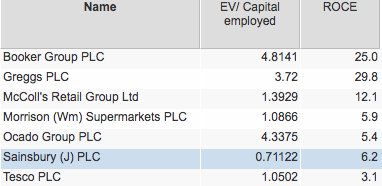
This ratio is strongly linked to a company's sustainable return on capital employed or ROCE. Good companies with high ROCE will usually see their market valuations - their EVs - trade at a substantial premium to their capital employed.
This is because high returns on capital add value to that capital. Low returns destroy value.
As a rough rule of thumb, a company will need a sustainable ROCE of around 10% to justify the value of its capital employed. As you can see, Sainsbury's trades at a big discount to the value of its capital employed due to its poor ROCE.
So if a company has sustainable ROCE of 20% then a multiple of 2.0 (20% divided by 10%) might be reasonable for the underlying business. You could then adjust this multiple higher if decent levels of growth at a high ROCE were expected to continue.
You could argue that Tesco's and Morrisons' EV/Capital Employed ratios are factoring a big improvement in sustainable ROCE from current levels. If this does not happen, then there is a case for arguing that their shares are overvalued on this measure.
Earnings power value (EPV)/EV
EPV (Earnings Power Value) gives you an estimated value of a business - an EV - based on its current operating profits (EBIT) after tax continuing forever. By comparing this value with the current EV you can have a feel for how much a company's current valuation is explained by its current profits and how much is based on future growth in profits. This ratio is one of my favourite ways of using EVs - I've called it EPV yield in the table below.
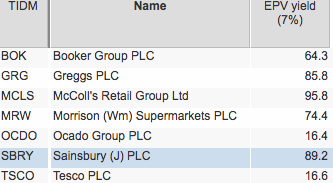
For example, McColl's has an EPV yield of 95.8% which suggests that almost all of its current EPV is explained by its current trading profits. Sainsbury is similar. Your job as an investor is to try and work out whether that is reasonable. Ask yourself:
- Can these businesses growth their profits from their existing business?
- Can they invest in new assets at reasonable ROCE (more than 10%)?
If the answer is yes, then perhaps the shares are undervalued.
Tesco and Ocado are the outliers here. More than 80% of their current EPV is explained by future profit growth. Again, ask yourself whether that is a reasonable expectation.
If you have found this article of interest, please feel free to share it with your friends and colleagues:
We welcome suggestions for future articles - please email me at analysis@sharescope.co.uk. You can also follow me on Twitter @PhilJOakley. If you'd like to know when a new article or chapter for the Step-by-Step Guide is published, send us your email address using the form at the top of the page. You don't need to be a subscriber.
This article is for educational purposes only. It is not a recommendation to buy or sell shares or other investments. Do your own research before buying or selling any investment or seek professional financial advice.