How to analyse companies with hidden debts
What I am about to discuss will be seen by most private investors as quite advanced financial analysis. However, if you are thinking of investing in the shares of airline, train or retail companies, and many others, then you need to understand one of the biggest risks that you will face as a shareholder - hidden debts.
By understanding what hidden debts are and how to analyse companies that have them, you will make better investment decisions and take on less risk.
What are hidden debts?
Hidden debts are debt-like liabilities that are not shown on a company's balance sheet as something like a bank loan or underfunded pension fund would. Accountants have been arguing about hidden debts for years whilst diligent investors have taken them into account when analysing and valuing companies.
The most common example of hidden, off balance sheet, debt is something known as an operating lease. I am not going to get into the accounting jargon here, that's not necessary. Examples of an operating lease are rents paid by retailers for their stores, by airlines for the aeroplanes and by train companies for their locomotives and carriages. In all these cases, the companies agree to rent the assets for an agreed period of time and then give them back to their owners.
The presence of rents or operating leases can have big implications for investors. If you ignore them, you can mistakenly think that a company is better or safer than it really is.
In this article, I am going to take you through what you need to know and how to analyse companies with large hidden debts. I am going to use the example of a retailer, B&M European Value Retail (LSE:BME), to show you all the practical analysis tools that you might need to use. (Read my article on B&M here.)
B&M European Value Retail and its hidden debts
When you are analysing a retail company such as B&M, one of the first things you should do is check out whether it rents rather than owns most or all of its stores.
Why?
Well, because renting and the commitment to keep on renting these stores in the future can represent a big liability that isn't disclosed on a company's balance sheet. Effectively it is hidden from view and is only found by digging deeply into a company's accounts.
Let me explain why this matters to you the investor.
A company such as B&M has two choices when looking to pay for a new store. It can pay for the whole cost itself upfront or it can rent it from a property company or landlord. If it buys or builds a store itself and pays for it with a bank loan then this is how it is shown in the company's accounts:
On the balance sheet the cost of the building is added to assets. The bank loan to pay for it is added to liabilities. In the income statement, trading profits (or EBIT) will be stated after depreciating the asset over its useful life. Pre-tax profits will then be stated after this extra depreciation and after the extra interest costs on the bank loan. The free cash flow of the company in the year(s) the store was built would be reduced by the total cost of building it.
If B&M rents the store instead something different happens. The company will typically enter into an agreement with the landlord to rent the building for an agreed period of time - maybe as long as 25 years but possibly five or ten years. B&M usually won't be able to get out of this agreement before the end of the agreed term without paying up the remaining rent owed.
Every year it rents the store, B&M expenses the annual rent against its income. These rents are known as operating leases. No asset or liability goes on its balance sheet and there is no cash outflow apart from the rent. So free cash flow looks a lot better than if the store had been paid for in full. However, this is not a free lunch because the company has signed up to pay a lot of rent in the future.
Accountants have been arguing about these kinds of rents for years. Many of them say that because companies like B&M are committed to paying rents, those commitments are a liability just like a loan. Also, the benefit of using the rented store should be seen as an asset. So both the store asset and the liability for future rents should be shown on the balance sheet.
By not doing this, companies are essentially hiding debt-like liabilities and understating their financial risks. A company's return on capital employed (ROCE) will also be overstated because the obligation to pay future rents is not on the balance sheet and therefore not part of capital employed.
You can find a company's future rent obligations (often referred to as non-cancellable operating leases) buried in the notes at the back of their accounts. Here's B&M's as of March 2015:
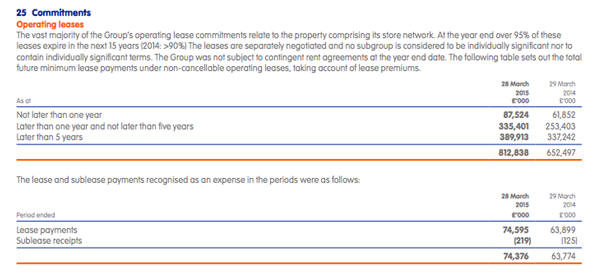
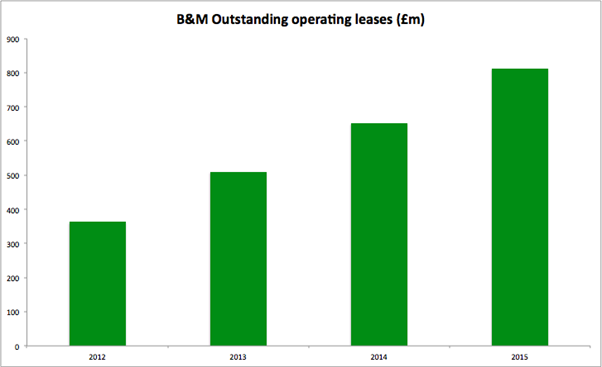
As you can see, B&M is on the hook for over �800 million of future rent payments. This is a big number which is not on its balance sheet and it has been growing significantly in recent years as the number of stores it trades from has increased.
How to analyse a company with large rental agreements
Big future rent commitments can be an issue for a lot of companies. You tend to come across them in a big way if you are looking at retail companies where the stores are rented and airlines which rent their aircraft fleet.
You need to make sure that you don't let these rents confuse you and make you think that a company is better or safer than it really is. Two useful things that you can do are:
- Calculate a company's fixed charge cover. This looks at how many times a company's trading profits can pay the interest payments on borrowings and any rental expenses.
- Calculate the capitalised value of operating leases. This will give you an estimate of hidden debt which you can then use to get a more meaningful estimate of financial risks and ROCE.
Fixed charge cover
To calculate this ratio, you take a company's EBIT and add the annual rental expense to it. You do this because EBIT is stated after rental expenses have been already deducted. You want to know the money available to pay rents and interest so you have to add the rental expense back to EBIT. Once you have this number, you divide it by the rental and interest expenses.
For the year to March 2015, B&M had normalised EBIT of �157.6m, rental expenses of �74.4m and normalised net interest expenses of �38.1m. Its fixed charge cover was:
(157.6 + 74.4)/(74.4 + 38.1) = 2.1 times.
This is quite a low figure but not uncommon amongst retailers who rent their stores. Anything below 1.25 times would be a worry. Fixed charge cover has been a great way to spot retailers in trouble in the past such as HMV, Game Group and Woolworths. These companies did not have huge amounts of debts on their balance sheets but the rental commitments crippled them when profits started falling. B&M's fixed charge cover shouldn't give investors any real cause for concern.
SharePad calculates fixed charge cover for you. As with all ratios the trend is as important as the absolute number.
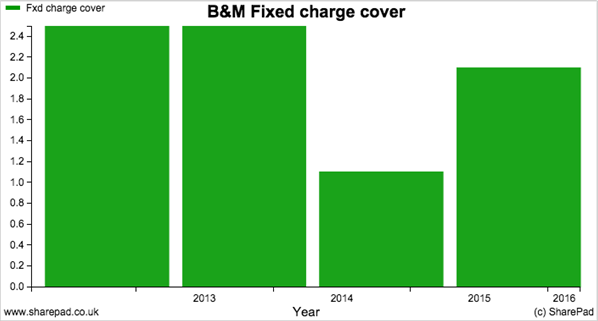
B&M's fixed charge cover has been falling slightly due to the rapid growth in new stores. As the profitability of new stores increases, the fixed charge cover should improve. However, as B&M has big expansion plans for lots of new stores this might not happen for some time yet.
How to estimate hidden debt
Good professional analysts and credit rating agencies view large future rent obligations as a form of debt. There are two ways to estimate what the value of this hidden debt might be.
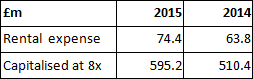
The first way is to discount the future lease commitments to their present value using an interest rate similar to the interest rate paid on existing borrowings (for more on the fairly simple maths used to discount future values to present values click here). A quicker way used by the credit rating agencies has been to multiply the current annual rental expense by eight. These two approaches are referred to as capitalising operating leases. In other words, you are working out what the total amount of the liability might be in today's money.
Here's an estimate of hidden debt or capitalised operating leases for B&M derived by discounting future leases at an interest rate of 5%.
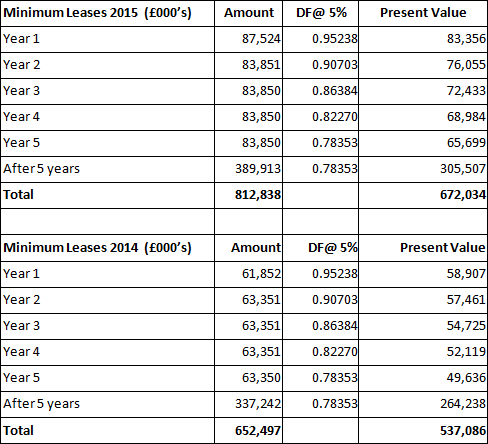
I am using the future operating lease commitments from B&M's annual accounts shown earlier. For years two to five I've taken the total number and divided by four to get an estimate for each individual year (For 2015, this was �335,401m/4 = �83.85m). The amount outstanding after five years has been discounted back to a present value as a single number.
This approach is telling me that B&M's hidden debt could be around �672m up from �537m in 2014.
The estimates are slightly lower using the eight times annual rental expenses approach as shown below:
These calculations are all well and good but how are they useful to an investor?
The best use of these numbers in my opinion is to calculate an adjusted return on capital employed (ROCE) figure. To do this you need to make a couple of adjustments to your existing calculation.
ROCE is calculated by dividing EBIT by average capital employed (CE). Capital employed is all sources of finance - equity and debt. We therefore need to compare it with the profits available to shareholders and lenders - EBIT.
Now, remember, we want to try and get an idea of what the profits (EBIT) would be if the company had built these assets using finance.
If this were the case then depreciation of the assets would have been taken off before EBIT but the interest payments on the debt would come off after (to give pre-tax profits).
A company's rental payments are also based on interest and depreciation of the asset. We can work out the value of each.
Rental payments are deducted before EBIT whereas we only want the depreciation component to be deducted. That is, we need to add back the interest component.
Using the discounting method above, I have calculated the value of B&M's capitalised leases to be �537m in 2014 and �672m in 2015. This gives an average value of �604.6m. Multiply by an interest rate of 5% (an estimate of what the company could borrow money for) and we get lease interest of �30.2m. Based on the annual rent bill of �74.4m we can infer that the remainder of �44.2m is mainly depreciation which should not be added back.
Add the average capitalised leases of �604.6m to average capital employed to get an adjusted average capital employed figure.
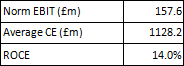
You can now calculate an adjusted ROCE. The SharePad and ShareScope ROCE figure for B&M for 2015 is 14%. Its calculation is shown below:
Here's the adjusted version:
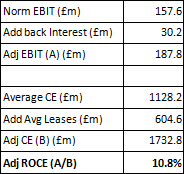
So ROCE falls from 14% to 10.8% on an adjusted basis. This might change your opinion of B&M's ROCE from reasonably good to modest. I'll let you decide. What is hopefully clear is that the existence of large rent commitments can change the way you perceive a company.
In SharePad, you can easily find out what a company's annual rent expense is - you'll find it in the Other Details section at the bottom of the Income Statement tab. You can then get a rough and ready estimate of what the hidden debt might be by multiplying it by eight. If you set up a portfolio in SharePad, you can export some really useful data to a spreadsheet and increase your understanding of companies.
Let me show you what you can do.
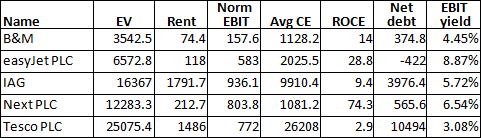
First of all, you can create a portfolio of shares in SharePad. Then add the following data columns and export it to a spreadsheet software program. I've done this for a selection of shares below:
You can now start adjusting this data for capitalised leases.
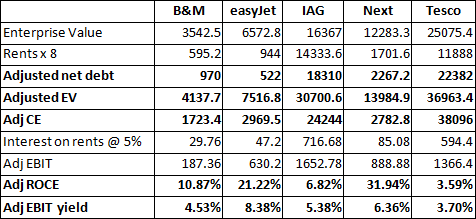
The differences in debt levels can be huge. For example, Tesco's net debt is not �10bn but over �22bn. International Consolidated Airlines has over �18bn of total adjusted debt. These are big numbers.
For every company except Tesco (because the assumed lease interest of 5% is higher than its unadjusted ROCE), the ROCE comes down. In the case of Next, the fall is quite substantial although the overall figure is still impressive.
The extra debt can also be added to enterprise value to get a lease-adjusted figure. This can then be compared with the lease-adjusted EBIT to see the adjusted EBIT yield.
However, in this case there is little change to the valuation of the five businesses on this measure compared with the unadjusted figure.
Be wary of sale and leaseback
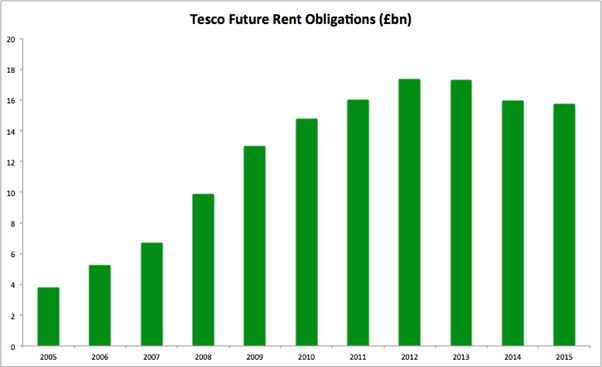
In recent times one of the easiest ways for companies to raise cash has been to sell some of their properties and rent them back (known as a sale and leaseback transaction). For supermarket companies such as Tesco this was actually a big warning sign that all was not well.
Without the cash proceeds from selling supermarket stores to property companies, Tesco would have had no free cash flow to pay dividends or make investments in its business. The cash inflow from property sales made it look as if Tesco's debt was nothing to worry about but the off balance sheet debt was increasing at a rapid rate as shown in the chart below. Tesco is now tied into long-term rent agreements for stores that aren't as profitable as they used to be. Trying to get out of these stores could prove to be very expensive. This is a good example of why you ignore hidden debt at your peril.
If you have found this article of interest, please feel free to share it with your friends and colleagues:
This article is for educational purposes only. It is not a recommendation to buy or sell shares or other investments. Do your own research before buying or selling any investment or seek professional financial advice.