New tools added to SharePad and how to use them
We've just added some great new tools and features to SharePad to help you with your investing. There will be lots more added over the coming weeks and months. I've written about these new tools in some of my recent articles and now you can start using them in SharePad. If you are relatively new to investing, you might find some of these tools a little daunting. Don't worry - stick to the basics until you feel comfortable with these more advanced tools.
Phil Oakley's debut book - out now!

Phil shares his investment approach in his new book How to Pick Quality Shares. If you've enjoyed his weekly articles, newsletters and Step-by-Step Guide to Stock Analysis, this book is for you.
Share this article with your friends and colleagues:
Earnings power value (EPV)
This gives you the value of a share based on a level of profits continuing forever.
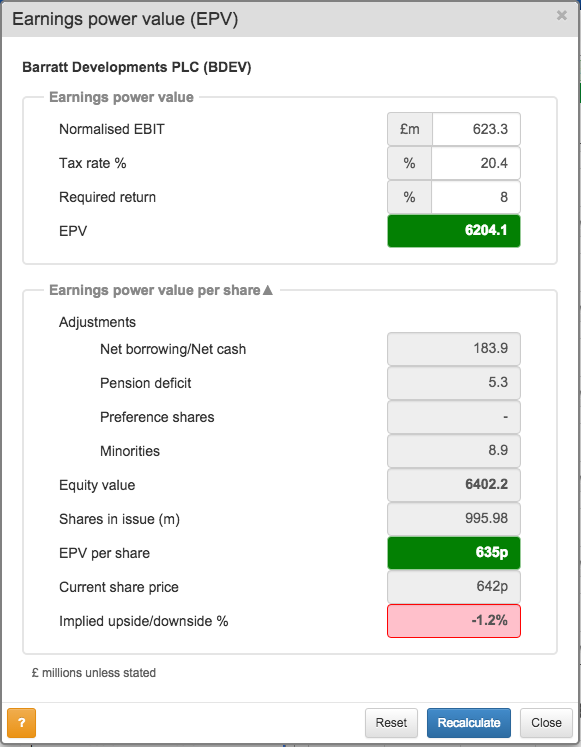
What level of profit you use (in this case EBIT) is entirely up to you. To get a value per share you need to enter three numbers into the white boxes:
- EBIT
- Tax rate
- Required return or interest rate (known as a discount rate)
SharePad will put the most recent values and a discount rate of 8% in as a default but you can choose your own values. You might want to use forecast profits or profits based on average profit margins for cyclical companies (companies where profits tend to move up and down with the fortunes of the economy).
In the example above, the EPV model is saying that Barratt Development shares are worth 635p each based on current EBIT staying the same forever. Your job is to work out whether profits will be higher in the future and stay higher.
For more on how to use EPV click here.
Dividend valuation models
We have created two dividend valuation models.
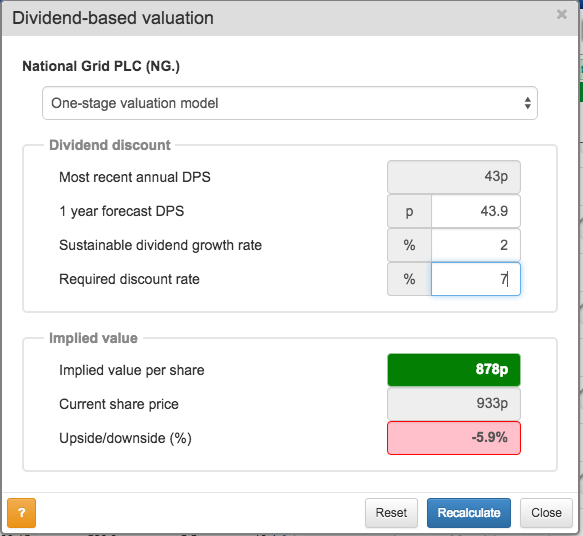
The one-stage valuation model is based on applying a constant rate of future dividend growth to the next forecast annual dividend per share. It needs three inputs into the white boxes:
- Forecast dividend per share
- Constant growth rate of future dividends
- A discount rate (default is 8%)
SharePad will use a forecast dividend per share (if there is one available) but you can also use your own estimate if you prefer.
The one-stage valuation is very useful for valuing stable, mature companies where most of the profits are paid out as dividends. This makes it quite useful for utility companies such as National Grid (see above) and financial companies such as banks or insurers.
The multi-stage dividend valuation allows you to value a company where dividends are currently growing at a fast rate but will eventually settle down to a more steady rate of growth.
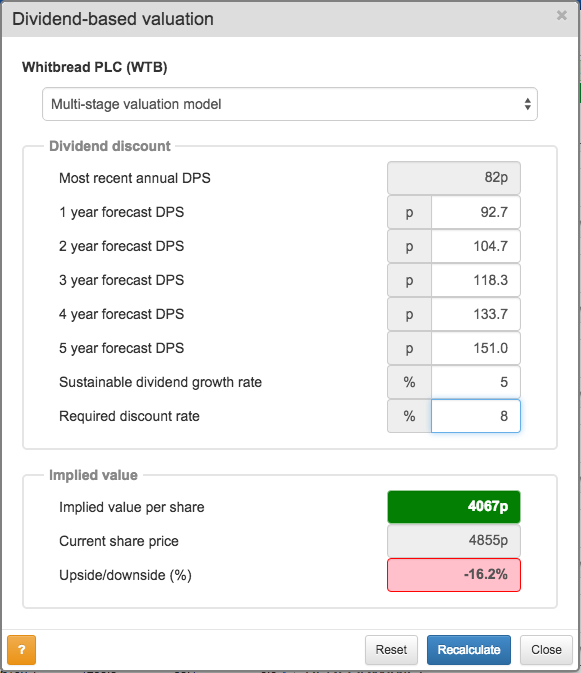
Here I've used Whitbread as an example of a company where shareholders have seen their dividends grow at a high rate in recent years. The most recent dividend has been increased by 13%, If we assume that that rate can continue for the next five years and then keep on growing at 5% forever then the model is telling me that Whitbread shares are worth 4067p based on the future dividends that shareholders might receive.
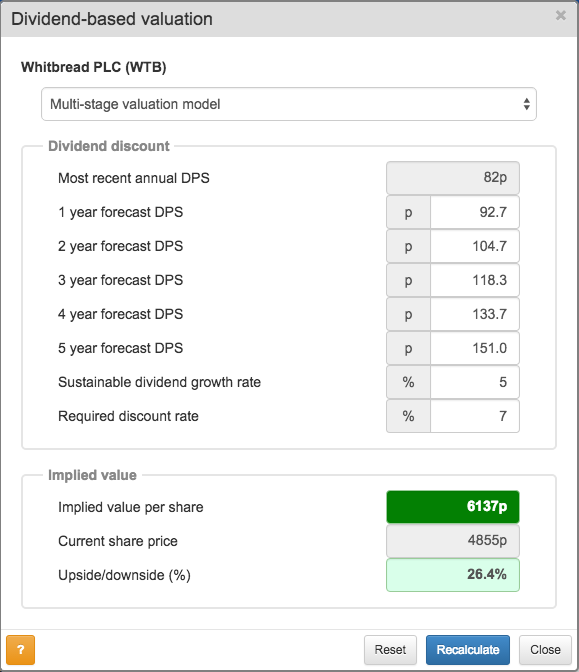
These models are very sensitive to your choices of discount rate or growth rates. For example, if I choose a discount rate of 7% rather than 8% the value of Whitbread shares goes up to 6137p.
Whilst you can use these models to work out the value of a share, I find them very useful to work out what a current share price is telling me about future dividend growth. I can play around with my assumptions until I get the same value as the current share price. If I think the assumptions are reasonable based on my research of the company I might buy some shares. If the assumptions are unrealistic, I will move on to look at another share.
For more on dividend valuation models click here.
Adjusting for hidden debts
Companies that rent rather than own assets can have lots of hidden debt. This can mean that investors might think a company is better, safer or cheaper than it really is. To read more about this click here.
We've built a tool that gets round this problem.
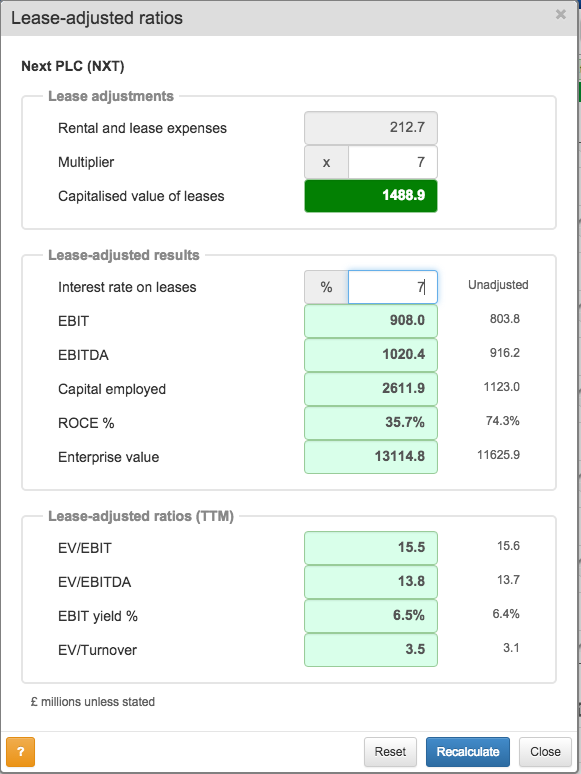
SharePad gives you the latest annual rental and lease expense for a company. All you have to do is decide what multiplier (credit rating agencies tend to use a range of 6-8 times annual rent expense) to use to get a value for the hidden debt (known as the capitalised value of leases) and the interest rate paid on it.
Once you have done that, SharePad will give you lease-adjusted results and ratios that you can compare with the unadjusted versions found in financial statements. For example, you might think that Next has a very impressive ROCE of 74.3% based on most conventional measures. However, it has an estimated hidden debt of nearly £1.5bn because it rents rather than owns its high street shops. This reduces ROCE to 35.7% (although this is still very impressive).
Is a share buyback good for my investment?
Share buybacks aren't always good for shareholders even if earnings per share (EPS) goes up.
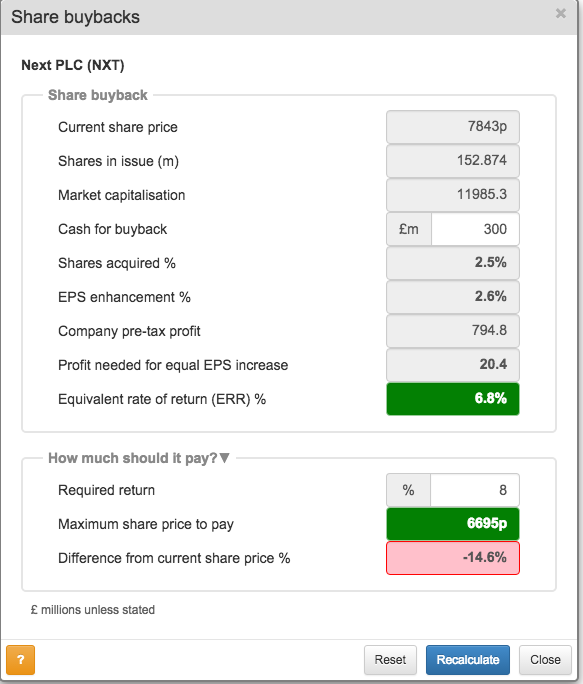
Next plc gave a great way for shareholders to work out if a share buyback is good for them in its 2012 annual report. It works out the equivalent rate of return of a buyback.
We've built this model into SharePad so that you can apply it to any share. When a company announces a buyback, just put the amount it intends to spend on the buyback and the rate of return you want from owning the share (default rate is 8%). SharePad will then give you the maximum price a company should pay to buy back its own shares and compare it with the current share price. If it is below the current share price, the box at the very bottom will be red, suggesting that a buyback is bad for shareholders. If it is above the current share price then the box will be green, suggesting that a buyback might be a good thing to do.
If you have found this article of interest, please feel free to share it with your friends and colleagues:
We welcome suggestions for future articles - please email me at analysis@sharescope.co.uk. You can also follow me on Twitter @PhilJOakley. If you'd like to know when a new article or chapter for the Step-by-Step Guide is published, send us your email address using the form at the top of the page. You don't need to be a subscriber.
This article is for educational purposes only. It is not a recommendation to buy or sell shares or other investments. Do your own research before buying or selling any investment or seek professional financial advice.