Not all profit growth is the same
What type of investor are you? Do you look for shares that are out of favour selling for cheap valuations - a value investor? Or are you looking to get rich by owning a stake in a business that is growing its profits - a growth investor?
If you are a growth investor then it is vital that you understand how a company has been growing its profits in the past. That's because not all profit growth is the same. How a company has been growing its profits tells you a lot about whether it can keep on growing them.
You might think you are buying the shares of a growth company, but if growth is coming from an unsustainable source then it can suddenly come to a juddering halt which can result in you losing money. Shares that were priced on the assumption of profits continuing to grow often crash when the growth stops.
In this article, I am going to use real company examples to show you the different ways of growing profits and how you can spot them. I will be looking at profit growth (measured by EPS) over the last five years. EPS is not a perfect measure of profit by any means but it is used a lot by investors looking for growth companies.
Phil Oakley's debut book - out now!

Phil shares his investment approach in his new book How to Pick Quality Shares. If you've enjoyed his weekly articles, newsletters and Step-by-Step Guide to Stock Analysis, this book is for you.
Share this article with your friends and colleagues:
The different types of profit growth
Profit growth usually comes from four main sources:
- Selling more
- Profit recoveries
- Cost-cutting
- Buying other companies
Let's look at these different types of profit growth in more detail.
Real or genuine growth from selling more
What do I mean by this?
This is when profits grow due to a company selling more of its products or services. This growth tends to be based on a long-term, sustainable demand for them where the company is able to do something a little bit different compared to its competition to exploit this trend and make lots of money.
The Apple iPhone is a great example of this. In the UK, I think that one of the best examples is the growth of Domino's Pizza (LSE:DOM).
But it's not just the fast rates of sales and profit growth that makes these companies stand out. It is how they have achieved that growth. What has made these companies fantastic examples of growth is that they haven't had to invest huge amounts of extra money to grow. This means that high rates of profit growth have also resulted in:
- High returns on capital employed (ROCE)
- Large amounts of surplus or free cash flow.
- Little or no debt.
It's not surprising why both Apple and Domino's Pizza have been so popular with investors in recent years. Let's look at Domino's in more detail.
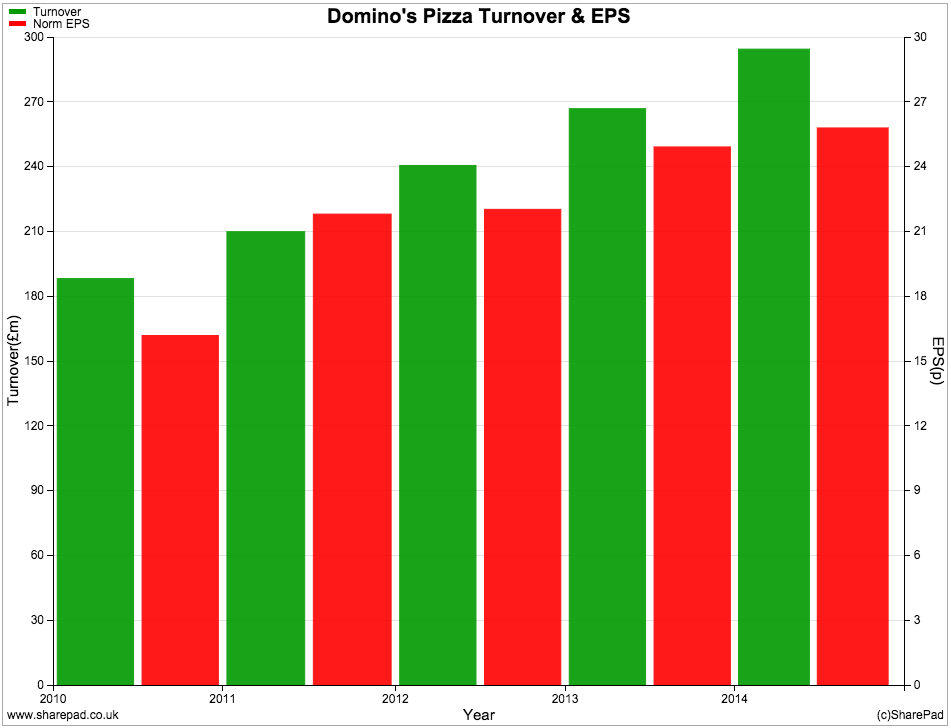
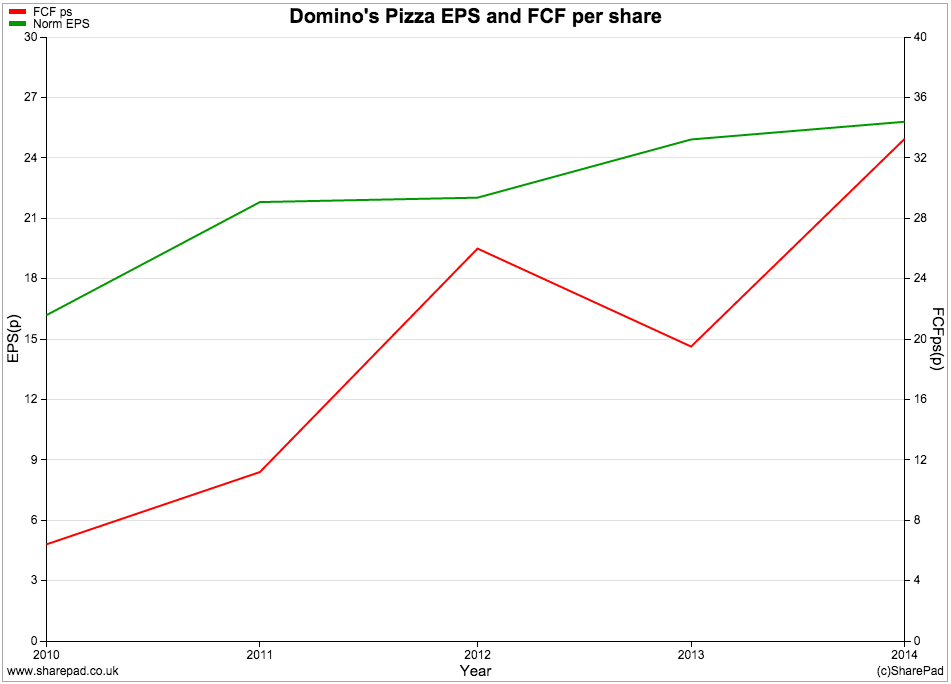
As you can see, turnover and profits have been growing nicely. Domino's has also been able to grow and generate free cash flow (not always easy) whilst free cash flow conversion has improved significantly and is virtually the same as EPS - a good sign of profit quality.
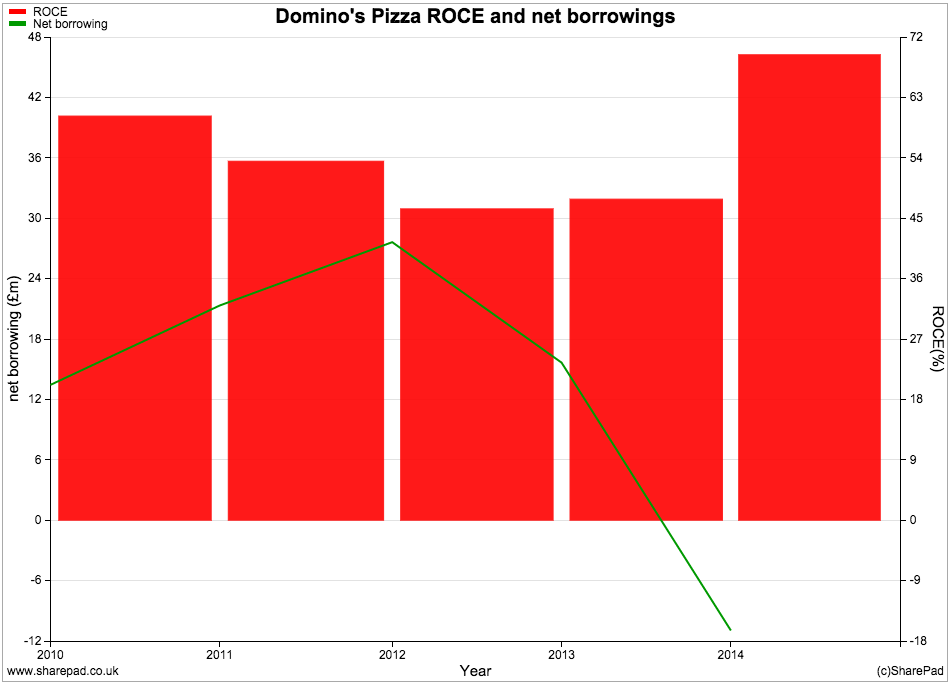
Return on capital employed has remained consistently high (even when hidden debts are taking into account) whilst the company's on balance sheet net debt position has disappeared.
Given this kind of financial performance and the prospects of further growth it is easy to see why Domino's Pizza shares are very expensive, changing hands for over 30 times forecast earnings.
Whitbread - spending money to grow
Most of us would ideally only invest in companies that can grow whilst generating free cash flow at the same time. These companies are quite hard to find. Finding them at attractive prices is even more difficult.
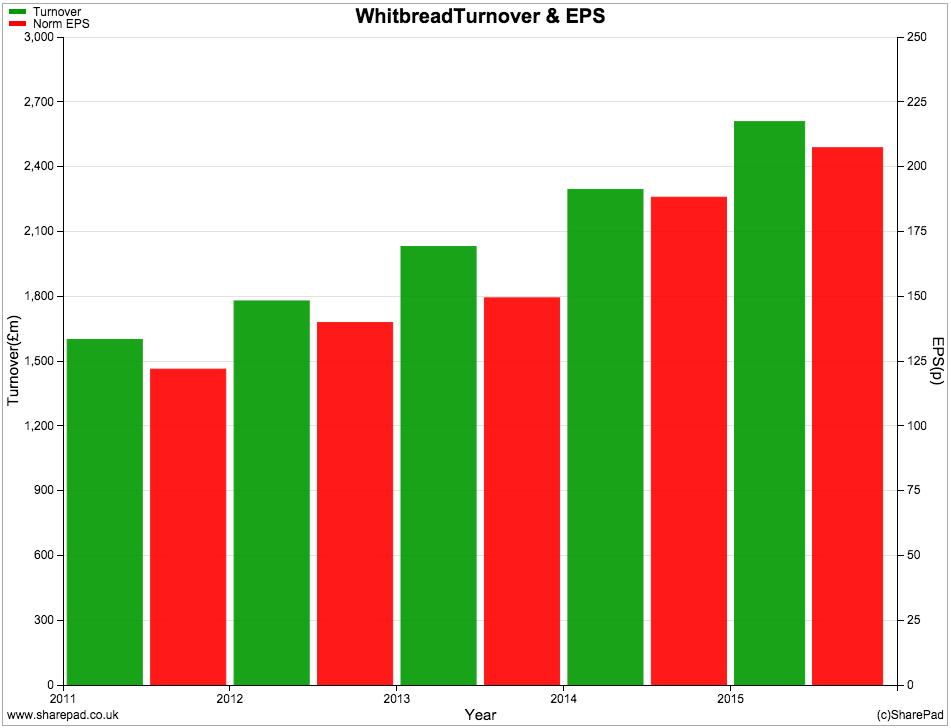
Companies such as Whitbread have also seen strong profit growth during the last five years. However, it has had to invest a lot of extra money in its Costa Coffee shops and Premier Inn hotels to get that growth.
The best place to see this is by looking at the company's cash flow statement.
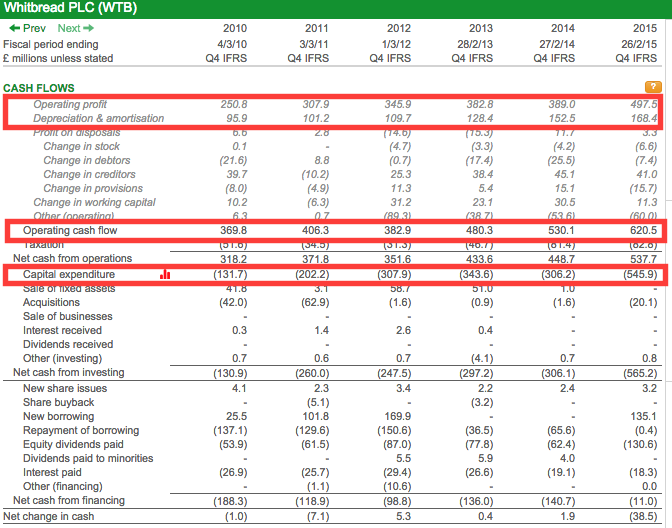
Here you can see that operating profits and operating cash flow have been growing which is a good sign. Now take a look at the capital expenditure line, this has been growing as well, especially during the last year.
Whitbread has been ploughing large chunks of the cash generated from its business right back into it. Last year it spent 90% of its operating cash flow on new assets (capex as % of operating cash flow) - a lot more than Domino's Pizza.
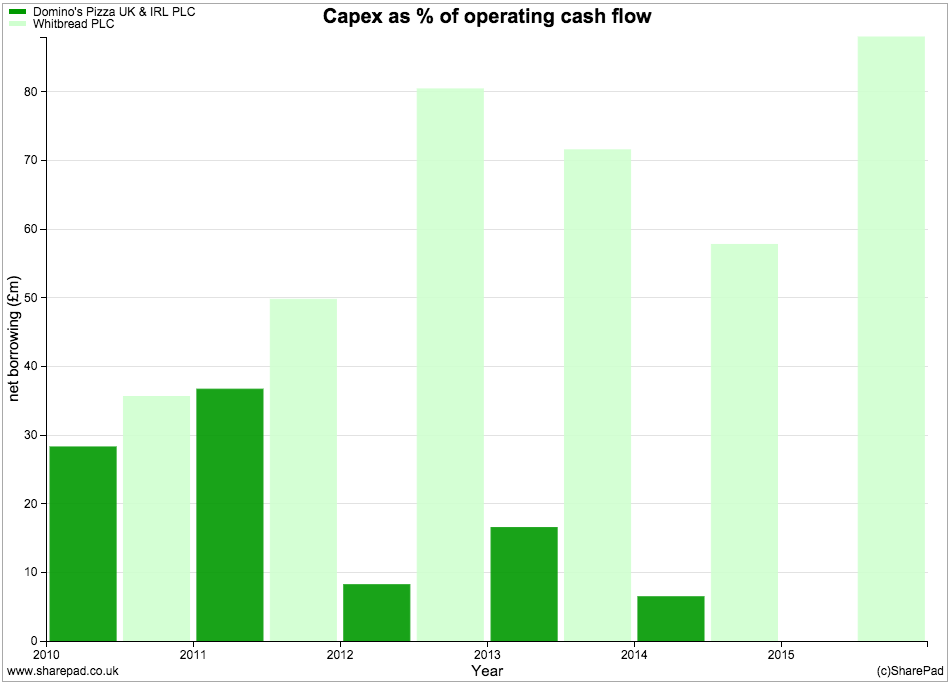
All this spending by Whitbread has helped to grow its profits but its free cash flow performance is not particularly impressive. Free cash flow per share was actually negative last year and clearly a lot less than EPS.
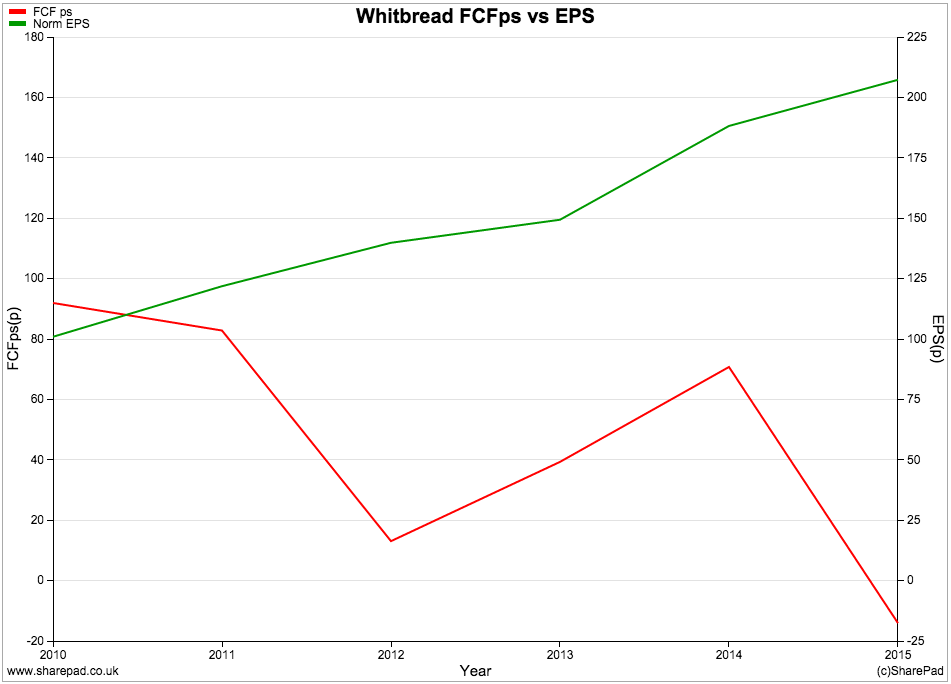
So when will Whitbread shareholders start seeing lots of free cash being generated? I don't know, but my view is that this will only happen when it stops opening new coffee shops and hotels which is when profit growth will probably slow - or stop - too.
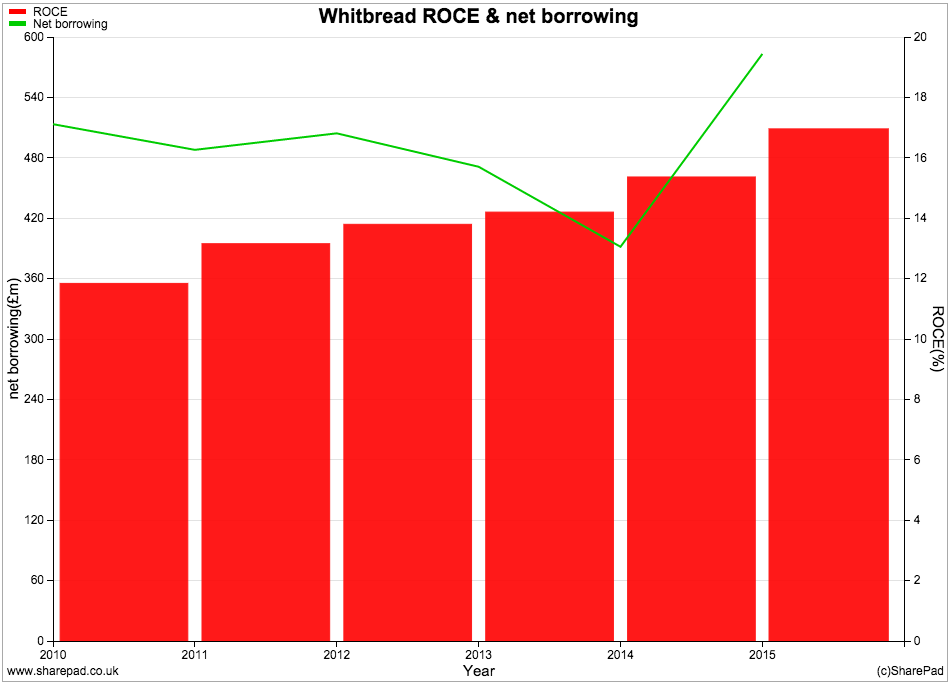
Whitbread has seen a modest increase in ROCE which is a welcome sign but growing the business has seen debt increase (although not to worrying levels).
Whitbread's profit growth has therefore not been as impressive as Domino's Pizza's.
Bellway - recovering profits
Housebuilding has been a classic boom-to-bust sector. At the moment, the profits of housebuilders such as Bellway are booming. But how long will the good times last?
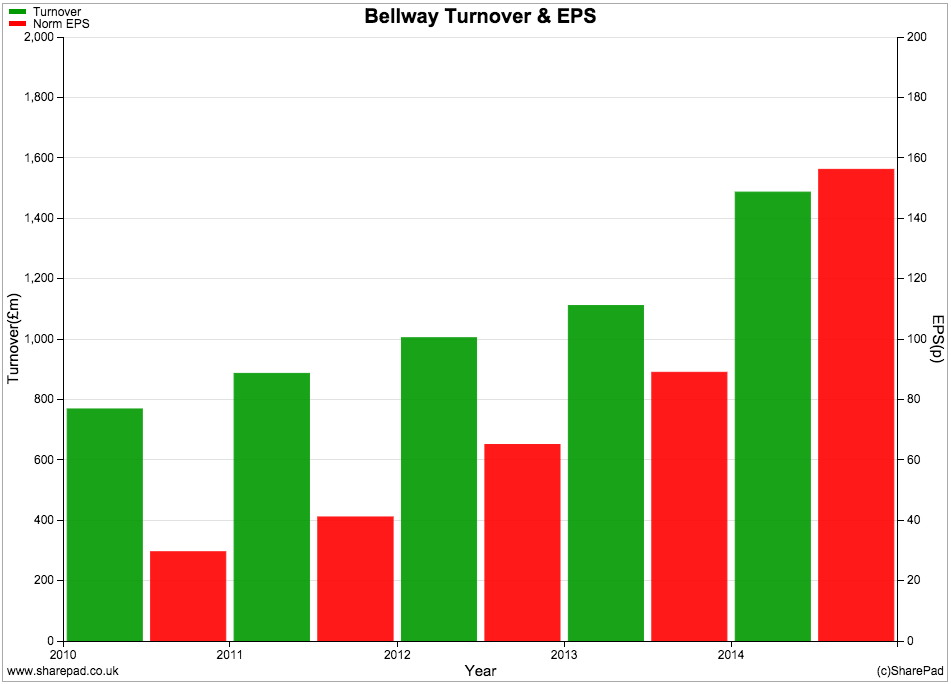
Bellway is a great example of what is known as a cyclical company. Its profits tend to move up and down in line with the economy and also what is happening to the housing market and house prices.
Have a look at the chart below. It shows Bellway's trading profits since 1988 (Yes, SharePad does have financial data that goes back this far). As you can see it was making next to no money during the late 1980s and early 1990s as both the economy and the housing market tanked.
Profits then soared during the late 1990s and for most of the early 2000s as Britain's housing market boomed. Then came the crash and Bellway started losing money. This was followed by a lacklustre recovery which has since picked up. Bellway profits are now at an all-time high.
I don't know if there will be another housing market crash but I wouldn't be surprised if there was and Bellway - along with other housebuilding companies - see their profits fall sharply again.
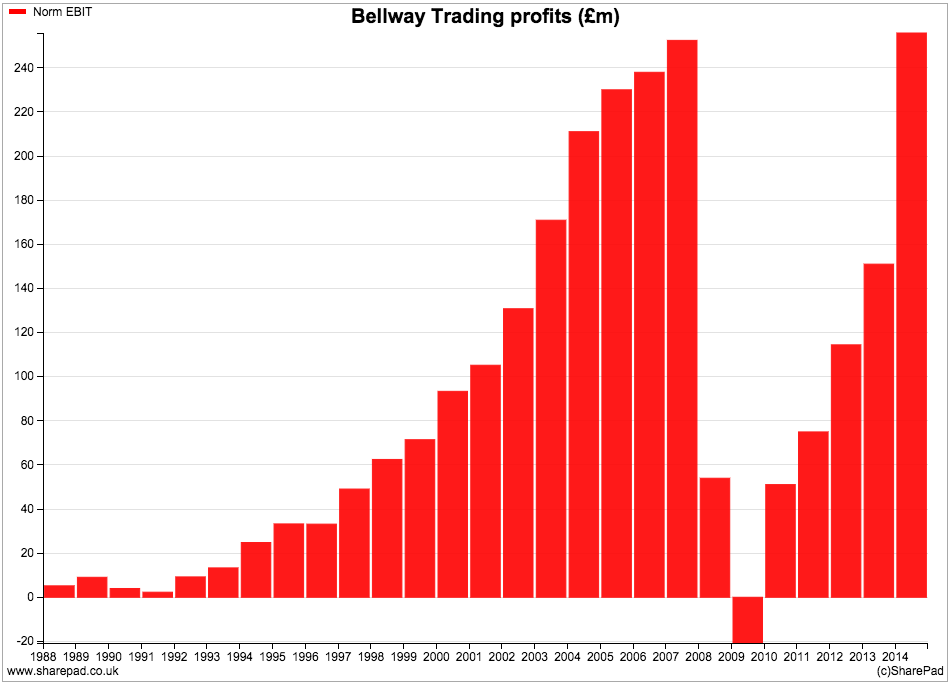
What this means is that the profit growth experienced by Bellway is very different from the growth experienced by the likes of Domino's Pizza or Whitbread. Bellway's growth is mainly due to the recovery from a previous trough. It is not due to a very long-trend of selling more houses at higher prices.
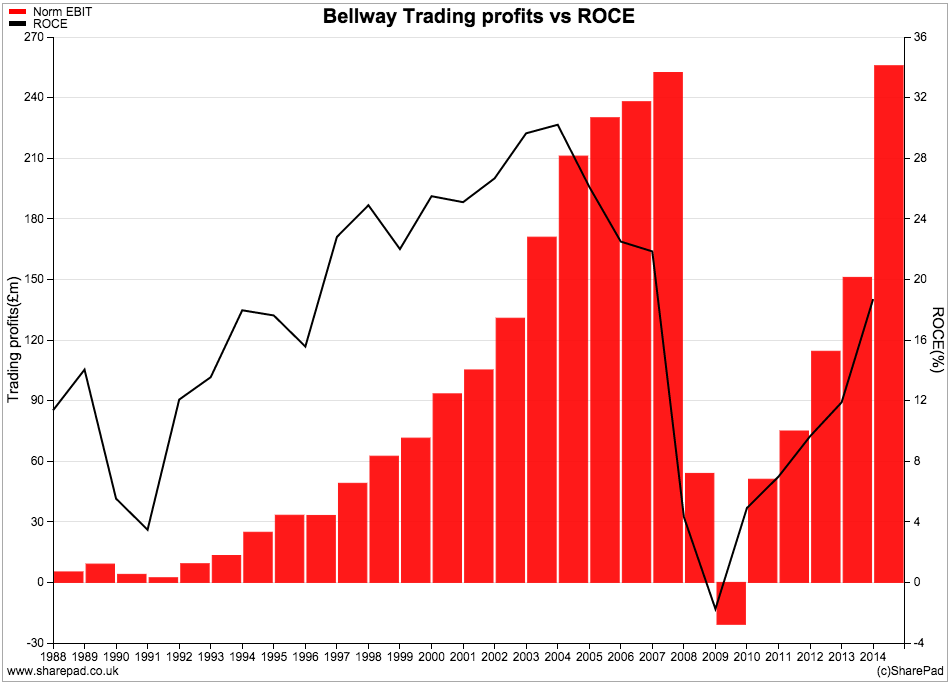
Its future growth prospects are arguably more difficult to call as well. Very few analysts called the top of the market back in 2007 and probably won't call the next top either. However, when it comes to cyclical companies you can get a rough feel for how near the top you are by looking at ROCE rather than absolute levels of profits.
Whilst profits are an all time high, ROCE is not. ROCE (profits as a percentage of money invested) peaked at around 30% in the mid 2000s compared with less than 20% now. The bull case for Bellway's profits is that profits and ROCE could conceivably go much higher if history is a reliable guide (it might not be, but we don't have much else to go on).
That doesn't mean that its shares are good value though. You need to look at the valuation of them and try and work out what's being priced in. You can use some of the new valuations tools in SharePad to try and work this out for yourself (click here to find out more)
If you come across a recovering cyclical company where ROCE has exceeded its previous peak, you should ask yourself what's different this time around? Businesses and industries can change for the better, but sometimes history can come very close to repeating itself.
WH Smith - the cost-cutter
WH Smith has defied the sceptics - who predicted that it would cease to exist - for many years now. It has been able to grow its profits despite its turnover falling (see chart above). It has done this by cutting costs and getting rid of low margin products. It has also benefitted by having some of its shops in captive locations such as railway stations and airports.
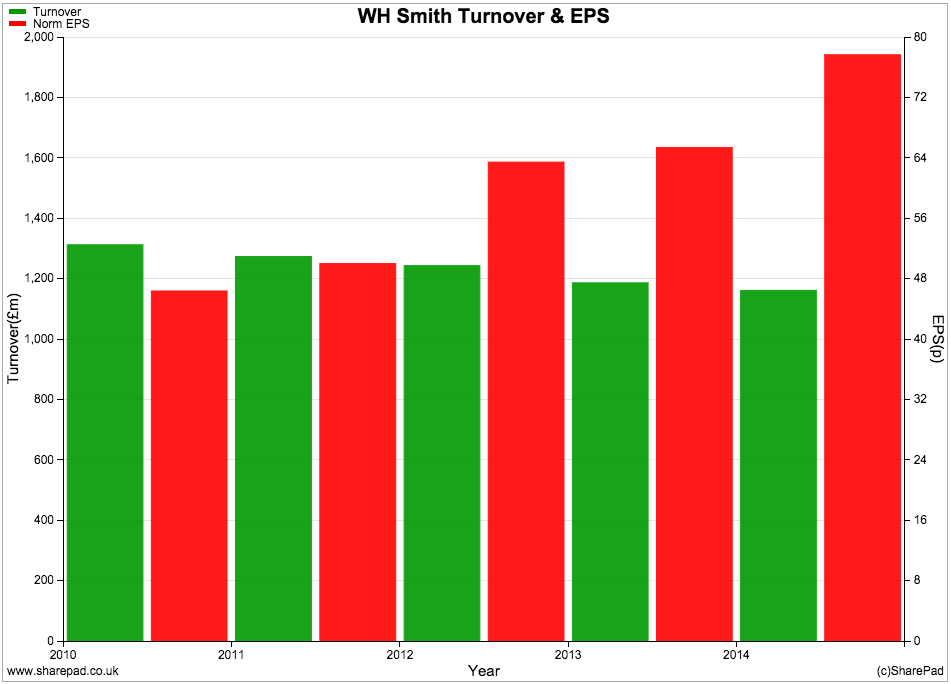
But what happens when the cost-cutting runs out? It is very difficult to grow profits without growing turnover as well for very long. Growth by cost-cutting should not be highly valued because it is unsustainable.
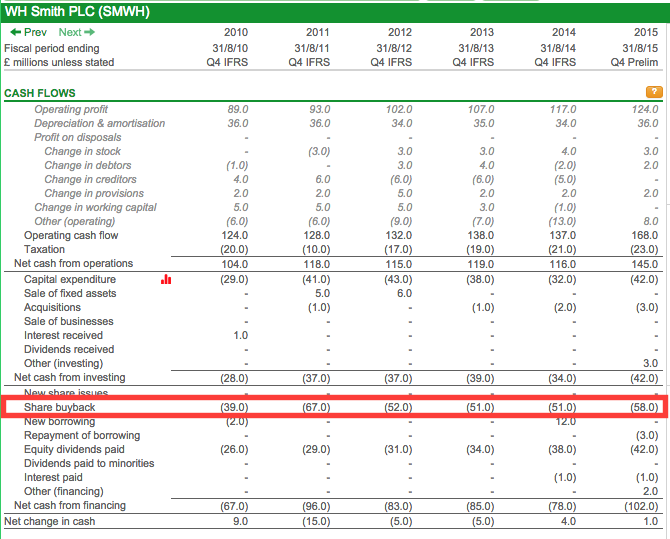
When it comes to EPS growth, a decent chunk of WH Smith's improvement has come from buying back shares and not just profit increases. Since 2010 the number of shares has decreased from 151m to 115.7m at a cost of £318m.
Put another way, if the number of shares had remained unchanged, normalised EPS for 2015 would have been around 68p rather than 87.1p and its growth record would have looked far less impressive and more in tune with a business that has not really been growing at all based on its turnover.
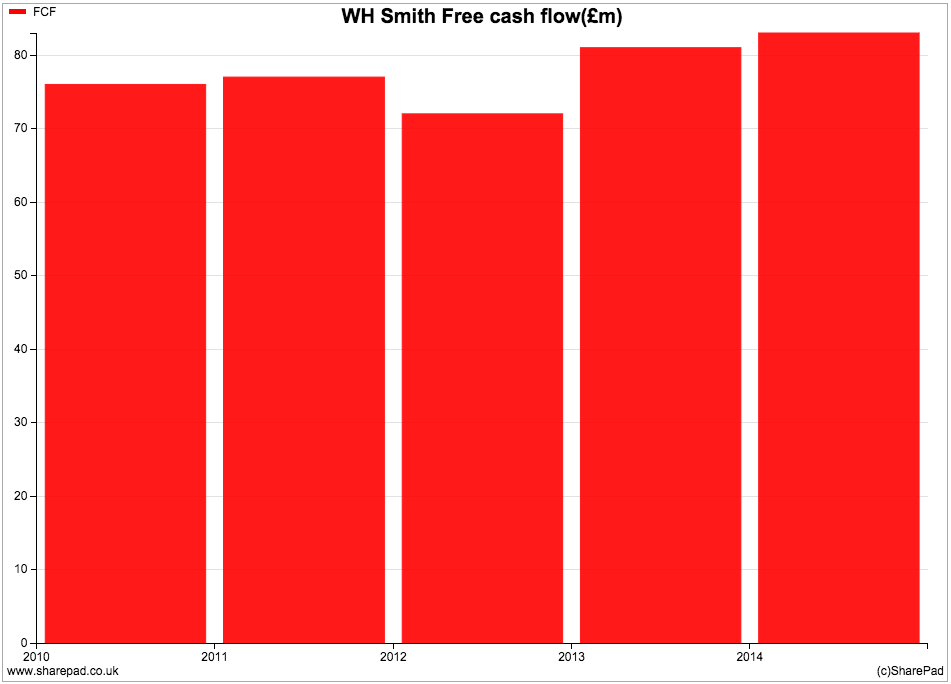
The amount of free cash flow produced by the company has hardly changed since 2010.
Buying profits - RPS
Apart from buying back its own shares, the easiest way a company can grow its EPS is to buy other profitable companies.
Some acquisitions can be a great success but they can be used to mask a business that is shrinking. Management can create the illusion of profit growth by buying companies and getting rid of a lot of overhead costs. The problem with this approach is that a company has to keep on buying companies to keep the profits growing. When the buying stops, profit growth can grind to a halt.
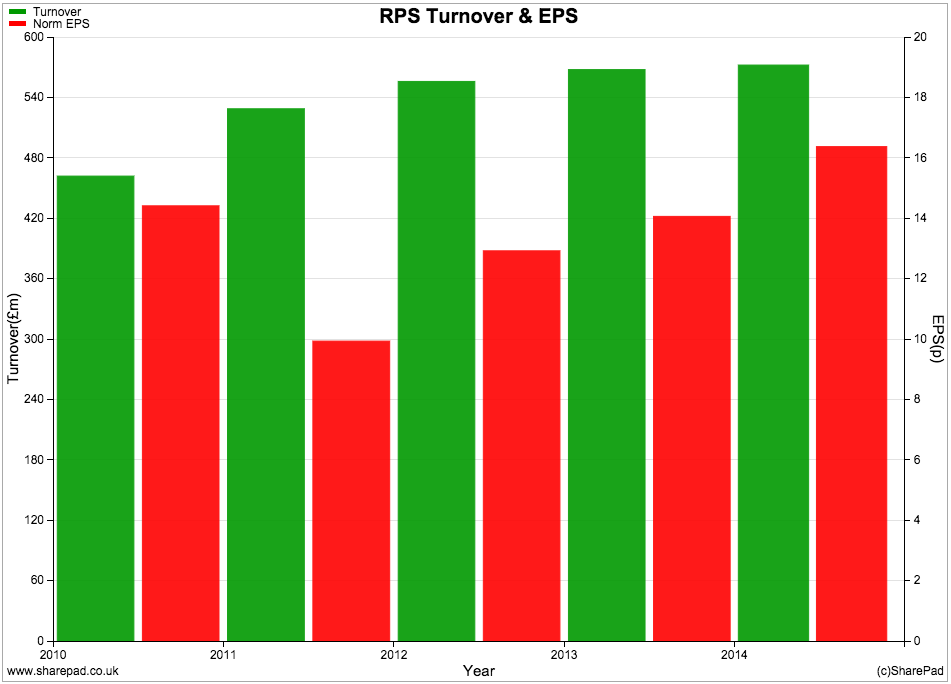
Now I haven't studied RPS - a consultancy business - in great detail but its financial performance could be a very interesting study of a company that keeps buying profits. EPS has grown quite a bit since 2011 but is everything as good as it seems?
Again, you will learn a great deal by spending some time looking at the cash flow statement of a company. Here you will see how much money a company is spending on buying other companies (known as acquisitions). If you see a company spending reasonable amounts of money every year on acquisitions then you should be a little bit suspicious. It might be perfectly above-board or the company might be trying to hide something.
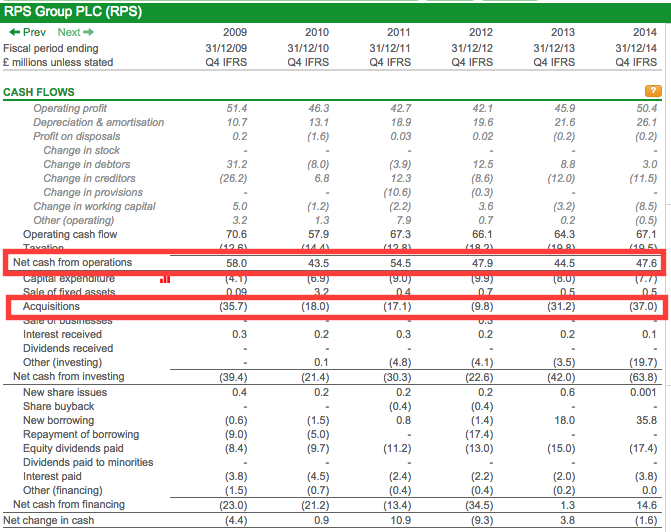
As you can see, RPS likes to get its wallet out and go shopping for new companies most years. 2013 and 2014 saw lots of money being spent.
Whist EPS has been going up recently, the amount of cash coming into the business (net cash from operations) was lower in 2014 than it was in 2009. This is despite £148.8m of cash being splashed out on acquisitions. Either these new companies haven't produced any extra cash flow or the existing businesses have been producing less. This is not a good sign.
ROCE has also fallen from 15.5% in 2009 to 11.5% in 2014. Consultancy companies are essentially people businesses, they don't need a lot of assets or money invested and should have reasonably high ROCEs and lots of free cash flow. The fact that RPS's ROCE has been falling is a classic example of how profit growth - and EPS in particular - can possibly fool investors that a company is improving when actually it isn't.
At first glance, RPS does generate meaningful free cash flow even though it hasn't been growing.
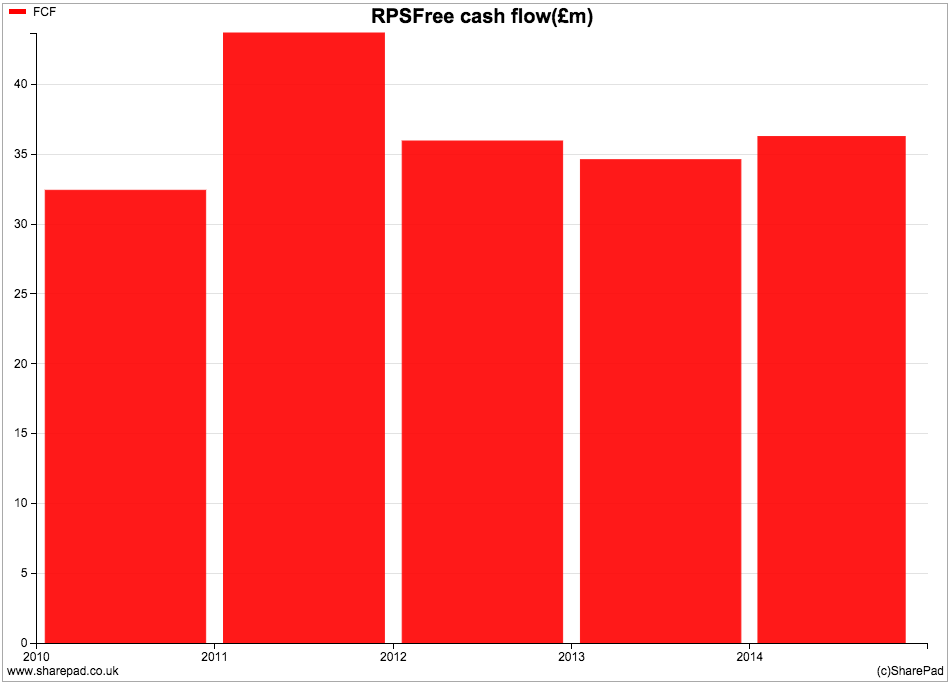
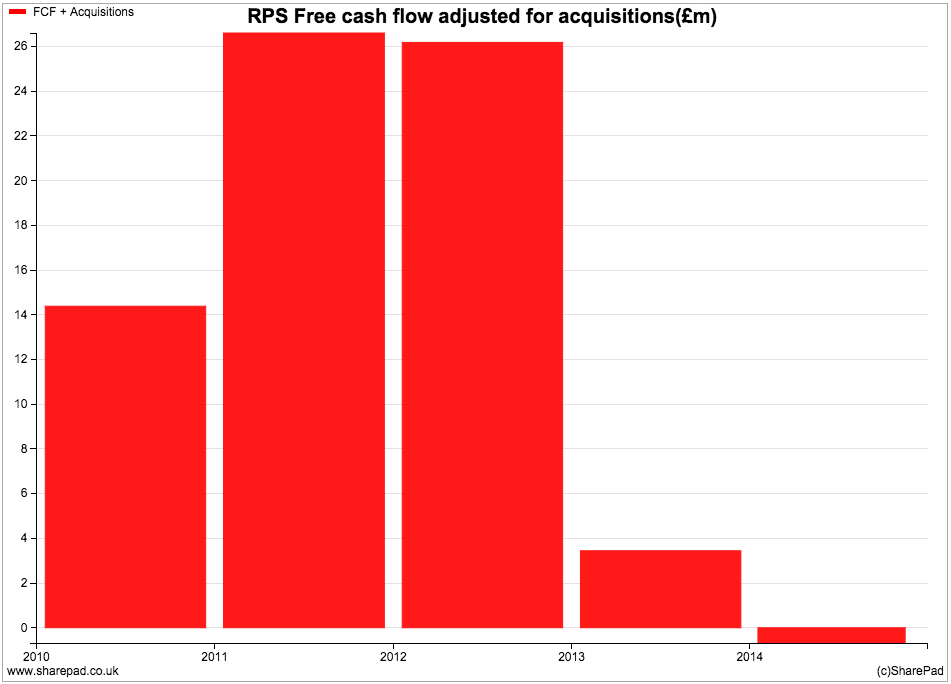
However, given the company's tendency to buy companies in most years perhaps free cash flow needs to be adjusted to take this into account (you can do this in SharePad by combining free cash flow and acquisition to create a new column or chart). If you do this then the picture is not as pretty.
To sum up
- Not all profit growth is the same.
- The source of profit growth tells you a lot about the potential for future growth.
- Be wary of using EPS as a measure of profit growth as it can be distorted by share buybacks
- Growth driven by selling more is the highest quality source of profit growth.
- Look at the trends in free cash flow and ROCE as well as profits.
- Study the cash flow statement carefully. You will learn more than looking at profits alone.
- Even free cash flow many not be what it seems. A company may decide to buy other companies rather than invest in its existing assets. The normal free cash flow calculation might need adjusting to reflect this.
If you have found this article of interest, please feel free to share it with your friends and colleagues:
We welcome suggestions for future articles - please email me at analysis@sharescope.co.uk. You can also follow me on Twitter @PhilJOakley. If you'd like to know when a new article or chapter for the Step-by-Step Guide is published, send us your email address using the form at the top of the page. You don't need to be a subscriber.
This article is for educational purposes only. It is not a recommendation to buy or sell shares or other investments. Do your own research before buying or selling any investment or seek professional financial advice.