A more thoughtful approach to Magic Formula investing
Joel Greenblatt's Magic Formula has been one of the most powerful and popular strategies used by private investors (click here to read my previous article about this).
Yet in recent years this formula has not been as successful in beating the stock market as it once was. One reason for this could be that the formula is ignoring some important financial numbers that could lead it to pick the wrong shares.
In this article, I am going to look at this strategy in more detail and show you some of the things you need to consider to keep you out of trouble. I'll also show you some new features we've introduced in SharePad to help you do this.
Phil Oakley's debut book - out now!

Phil shares his investment approach in his new book How to Pick Quality Shares. If you've enjoyed his weekly articles, newsletters and Step-by-Step Guide to Stock Analysis, this book is for you.
Share this article with your friends and colleagues:
The simplicity of the Magic Formula
It's all about buying good quality companies at good prices.
Greenblatt defines a good company as one that makes a lot of money (profits) compared with the money it invests in the assets to make those profits (known as capital employed). In financial jargon these companies have high returns on capital employed (ROCE).
To make money and do better than the stock market as a whole you have to buy good companies at attractive prices. For Greenblatt, an attractive price is when you are getting a lot of profit (EBIT) compared with the cost of buying the whole company - known as its enterprise value (EV). These companies have a high earnings yield (EBIT/EV).
To put this Magic Formula to work you simply rank a list of stocks (usually a stock market index like the FTSE-All Share) from the highest (ranked 1) to the lowest for both ROCE and EBIT yield and add the rankings together. You then buy a 20-30 stock portfolio with shares that have the lowest combined ranking scores and hold them for a year before going through the same process again.
This seems to be a fairly simple and straightforward investing strategy. Like most of these popular strategies it comes with the costs of buying and selling 20-30 shares on a regular basis which needs to be paid for. However, the Magic Formula's ability to beat the stock market has not been very good during the last six years. This just goes to show that not all strategies work all of the time.
Perhaps it is time to consider a more thoughtful approach to Magic Formula investing?
It is worth remembering that a stock screen is just the starting point. The historical success of most screens has usually been tested on the basis of buying a basket of qualifying stocks. Performance of the basket will likely be a mixed-bag with the winners outweighing the losers. In practice, most private investors do not buy a basket of stocks but one or two. This increases your risk of picking the duds and is why we have added some options to our Magic Formula - so that if you do choose just one or two stocks you have a better chance of avoiding companies which look better than they are.
Practical issues with the Magic Formula
I've been doing a lot of thinking about the Magic Formula recently. I like the simplicity of it and think that the basic formula is very sound. But I have some issues with the calculations of the two main bits of it - ROCE and EBIT yield.
My feeling is that Greenblatt's way of calculating these two ratios could be too simplistic and could lead investors to pick bad shares thinking that they are good ones. Let's look at ROCE first.
Issues with ROCE
Greenblatt defines ROCE as follows:
EBIT/(Net working capital + Net fixed assets)
The EBIT bit of this calculation is fine. What is more contentious is the definition of capital employed. Greenblatt wants to look at the physical or tangible assets that go into making the company's EBIT.
Net working capital is calculated by taking current assets (mainly inventories, debtors and cash) and taking away current liabilities (such as money owed to suppliers and accrued expenses such as wages and taxes that haven't been paid yet). Greenblatt then excludes short term borrowings from current liabilities and excess cash (he doesn't say how you calculate this bit) from current assets.
Net fixed assets are the depreciated values of things such as buildings and plant and machinery.
Ignoring intangible assets
I see a number of problems facing the investor when using this calculation. Greenblatt's calculation excludes intangible assets such as goodwill, brands and patents.
Let's take the issue of goodwill. Goodwill is the extra amount of money paid on top of a company's net asset value (NAV) when it is bought by another company. Say a company has net assets of £100m and the company is bought for £200m. That extra £100m above NAV is the value of goodwill. Greenblatt ignores this when calculating ROCE.
Yet shouldn't the owners of the buying company expect to get a return on the actual £200m spent? It's like saying the extra £100m doesn't matter when in practice it matters a lot.
By ignoring goodwill the Magic Formula will favour companies that grow by buying others. These companies can be terrible investments because they pay too much for their acquisitions. This would be picked up in a ROCE figure that includes goodwill in capital employed as it would be a lot lower than the ROCE used by the Magic Formula.
The same argument can be made for other intangible assets such as brands and patents. These numbers on the balance sheet represent money that has been spent developing them - money that needs to earn a return for investors.
It doesn't seem right to include the EBIT that comes from those brands but exclude the money invested in them when calculating ROCE. This makes ROCE look higher than it really is and might trick you into thinking that the company is better that it really is.
Ignoring off-balance sheet assets and debts
Greenblatt also ignores off-balance sheet assets such as rented offices, shops and machinery. Companies with lots of off-balance sheet assets (and off-balance sheet debts) can seem to have very high ROCEs if you calculate capital employed the way that Greenblatt suggests. Retailers are a good example of this.
If you adjust ROCE so that the estimated value of rented assets are added back to capital employed you quite often find that a high ROCE at first glance can look very modest once the adjustments have been made. This means that a company that looks good under the normal version of the Magic Formula might not be as good as it seems. Buying companies like this might be a mistake.
Issues with EBIT yield
This is calculated as follows:
EBIT/Enterprise value
Again the EBIT part of this calculation is fine. But the definition of enterprise value needs some further consideration. Greenblatt calculates EV as simply a company's market capitalisation (the market value of all its shares in issue) plus its net debt (total debt less cash).
This is a very basic definition of EV. It does not actually represent what a buyer of a whole company would have to pay. Minority shareholders would also have to be bought out as would the holders of any preference shares. These values need to be added to EV
Then there's the issue of pension fund black holes (pension deficits). Anyone buying the whole company would have to take on this liability as well and so this needs to be added to EV too. Rest assured that the trustees of any final salary pension scheme would insist that a funding shortfall was going to be made good before the company was sold.
There's also a case for arguing that certain provisions for things like clean-up costs for industrial companies and deferred payments for previous acquisitions should be included too, although not many people do this.
If investors do not use an accurate version of enterprise value and instead use one that understates it they will be tricked into thinking that the EBIT yield is higher than it really is. They might think they are buying a cheap share when it might not be.
SharePad and Magic Formula investing
Greenblatt's Magic Formula in its simplest form does not have a comprehensive measure of ROCE or EBIT yield. Any investor using this strategy may run the risk of picking shares that are neither good nor cheap.
We have made a number of adjustments and changes for users of this strategy in SharePad. Here's what we have done:
We have added pension fund deficits to all calculations of enterprise value. So now:
EV = Market capitalisation + total debt - cash + minority interests
+ preferred equity + pension fund deficit
Just as an aside, I think the netting off of cash in calculating EV's is quite contentious and something that I am not entirely comfortable with. A company's cash balance on its balance sheet date may not be representative of cash balances throughout the year. The cash may not actually be available to repay borrowings but might be needed to pay outstanding bills at the year end. Interestingly, Greenblatt who suggests making an adjustment for excess cash when calculating capital employed makes no such suggestion when discussing EV.
I will explore this topic further in a future article. For now, SharePad is calculating EV by deducting cash as this is still widely used by most investors.
There are now four options for calculating capital employed when using the Magic Formula:
Standard calculation
= Total tangible assets - current liabilities + short term debt
This is the closest definition of capital employed to the Greenblatt version. It excludes intangible assets.
We have not made any adjustments for excess cash as Greenblatt does. We think it is virtually impossible for a company outsider to work out how much spare cash a company actually has at its disposal. We therefore include all cash in capital employed and are effectively saying that a company has to earn a return on that cash.
On a more important point, there are other good reasons for not netting off cash balances from capital employed. Remember that a balance sheet is a snapshot on one day of a year. Companies like to make their finances look as good as possible and so tend to choose a suitable year end for this to happen. Cash balances and debt levels can be very different throughout the year for many companies.
Then there is case of whether the cash is available for the company to use as it wishes. Companies can boost year-end cash balances by delaying the payment of their bills until after the balance sheet date. The bills still have to be paid with cash sooner or later.
Including intangibles
= Standard calculation + Intangible assets
This is total assets less non-interest bearing current liabilities (which is why short-term debts are added back). This is derived from the asset side of a company's balance sheet. The same number can be derived by adding total equity, total borrowings and other long-term liabilities.
Lease-adjusted version
= Standard calculation + Capitalised value of leases
SharePad allows the user to estimate the value of leases and add this to the standard calculation of capital employed.
Lease-adjusted inc. intangibles
= Standard calculation + Intangible assets + Capitalised value of leases
You may be very happy to continue using a simple version of the Magic Formula as suggested by Greenblatt. However, given the issues that I have raised in this article you might want to consider a more thorough version. It might stop you buying a basket of shares that at first glance look attractive but actually might not be. As you will see, the different versions can give different baskets of shares to buy.
Different versions of the Magic Formula in SharePad
Finding good quality companies trading at reasonable prices is a good starting point when you are looking for candidates for your portfolio. SharePad allows you to search for them using slightly different versions of a Magic Formula approach. It's up to you which one you decide to use.
I've constructed four different 30 stock portfolios based on a Magic Formula ranking approach. SharePad ranks every share with a market capitalisation of more than £100m and excludes financial and utility companies.
SharePad has selected four baskets of shares from the FTSE All-Share index. Because the Magic Formula rankings are based on all qualifying London stock exchange shares the rankings will not always follow the sequence of 1,2,3...30. There will be cases when a higher ranking share is not a member of the All-Share index and will be excluded.
The table below summarises the differences in the portfolio from each other. Leases and intangible assets do seem to make a big difference to the makeup of the portfolios. The portfolios are shown in detail afterwards.
| 30 share portfolio | Identical shares to Standard Portfolio |
|---|---|
| Standard (exc. intangibles) | 30 |
| Standard (inc. intangibles) | 15 |
| Lease-adjusted (exc. intangibles) | 23 |
| Lease-adjusted (inc. intangibles) | 16 |
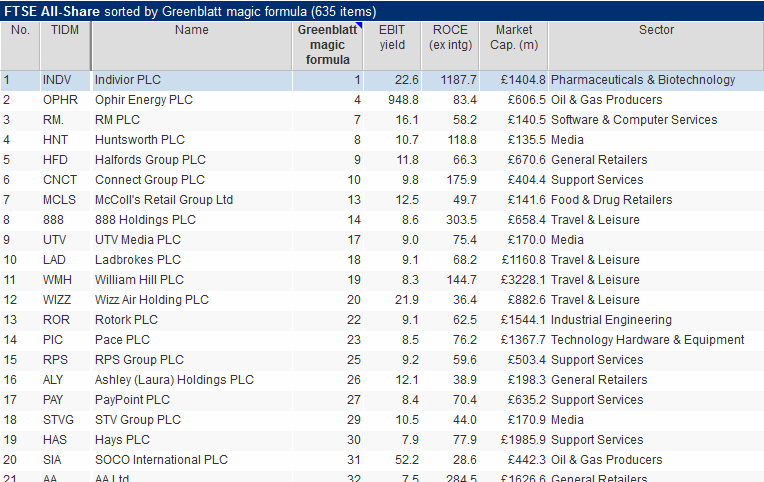
Standard (excluding intangible assets)
This approach uses the standard approach to calculating capital employed and excludes intangible assets. It is the closest version in SharePad to Greenblatt's original Magic Formula.

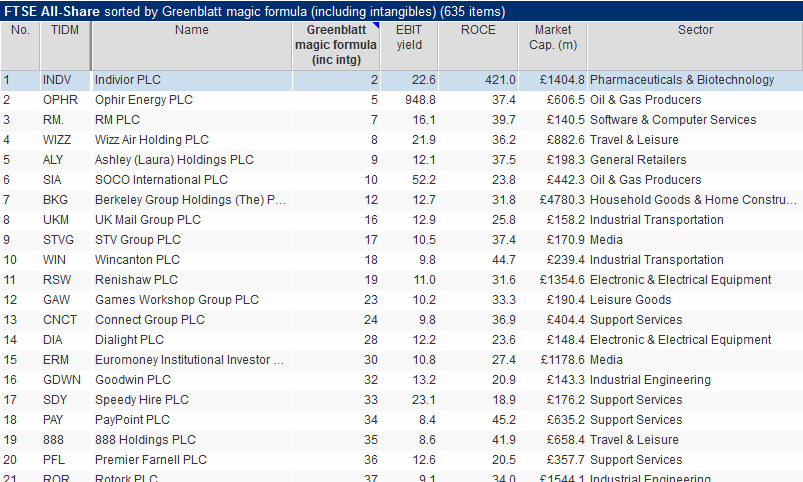
Including intangible assets and goodwill
This is similar to the version above but includes intangible assets and goodwill in the calculation of capital employed.

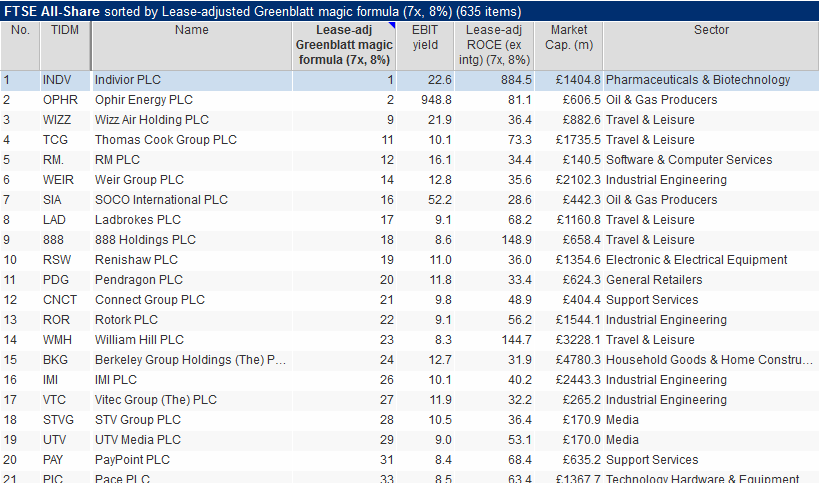
Lease-adjusted excluding intangible assets
This version includes the capitalised value of leases and excludes intangible assets.

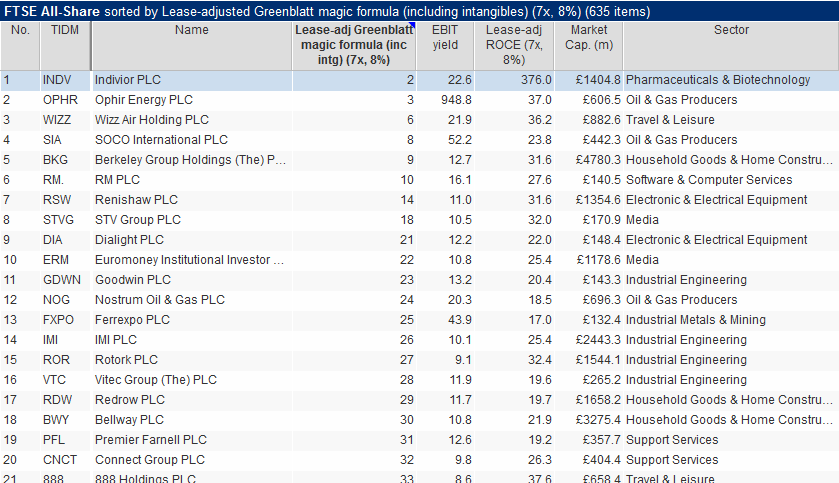
Lease-adjusted including intangible assets and goodwill
This version includes the value of leases and intangible assets. In my opinion, this measure gives the most conservative estimates of ROCE and EBIT yields.

The Magic Formula and individual shares
Greenblatt's Magic Formula is meant to be used to buy a portfolio of 20-30 shares. This is to reduce the risk of having too many eggs in too few baskets so that bad performances from a few shares don't ruin your portfolio. This is no guarantee that a portfolio selected on this basis will make money or beat the performance of the stock market as a whole.
However, buying good companies at attractive prices is what successful investing essentially boils down to.
As I said earlier, picking just one or two stocks with a high Magic Formula rank increases your risk. That's why we've provided options for the Magic Formula to help you identify individual shares more safely. I would always recommend doing a little more research as well.
For example, the Magic Formula is only based on the current value of ROCE. That might be a peak value that is about to fall which means buying the shares could be a mistake. On the other hand, a low ROCE which is about to improve might be rejected.
SharePad makes it easier to do effective in-depth research because it has more than 20 years' financial history. It enables you to find stocks that have done well over a number of business cycles rather than just during the recent bull market.
For example, you could screen for companies on the basis of their five or ten year average ROCE to iron out the peaks and troughs in profits and returns. Or you can refine your filter to an individual sector of the stock market. You can make it as simple or advanced as you wish.
It is rarely a good idea to blindly buy a share of a company based on the results of a screen or filter alone.
If you have found this article of interest, please feel free to share it with your friends and colleagues:
We welcome suggestions for future articles - please email me at analysis@sharescope.co.uk. You can also follow me on Twitter @PhilJOakley. If you'd like to know when a new article or chapter for the Step-by-Step Guide is published, send us your email address using the form at the top of the page. You don't need to be a subscriber.
This article is for educational purposes only. It is not a recommendation to buy or sell shares or other investments. Do your own research before buying or selling any investment or seek professional financial advice.