How to analyse a sector in SharePad - Housebuilders
Recently I showed you how you could quickly analyse an individual company in SharePad (click here to read more about this). In this article I am going to show you how to extend this approach to analysing a sector or subsector of the stock market.
SharePad is very good at allowing users to look at a sector. When you are thinking of buying a share of a company it is often a good idea to look at the shares of similar companies as this can enhance your understanding of the company you are looking at. Alternatively, you might have decided to invest in a particular sector and need some help to make up your mind which share or shares to put your money into.
Phil Oakley's debut book - out now!

Phil shares his investment approach in his new book How to Pick Quality Shares. If you've enjoyed his weekly articles, newsletters and Step-by-Step Guide to Stock Analysis, this book is for you.
Share this article with your friends and colleagues:
To start analysing a sector in SharePad, follow these easy steps:
- Select a list such as the FTSE 350.
- Click on the Filter button in the List view and select Apply sector filter.
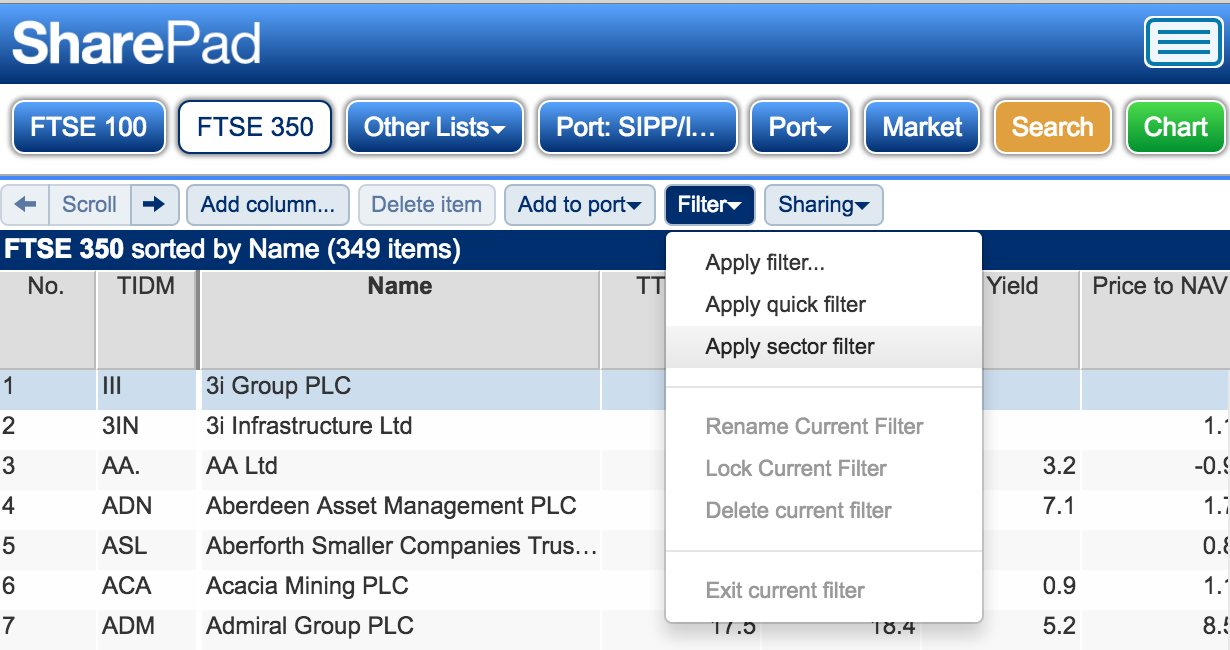
- Then choose the sector you want to look at. In this instance I've chosen the Home Construction subsector to look at the shares of housebuilding companies.
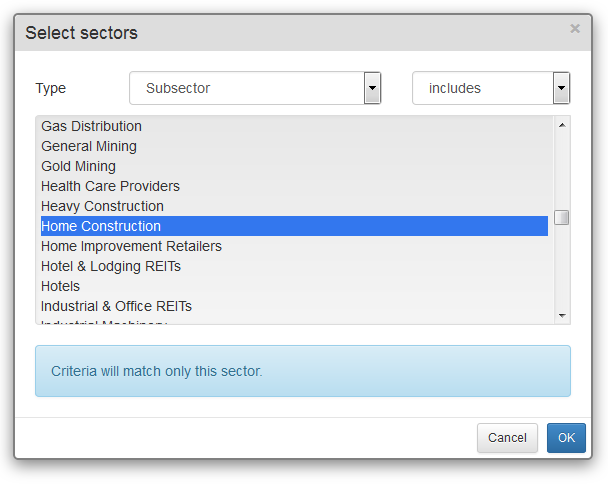
- Once SharePad has filtered the list so show the sector constituents, add them to a new portfolio (watchlist):
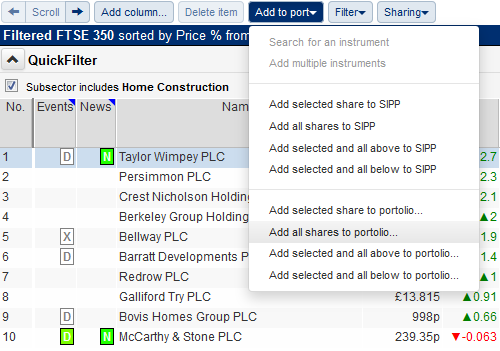
- Give your portfolio a name such as Housebuilders

You are now ready to begin analysing the sector. I find it easier to create a new List setting with the columns I want.
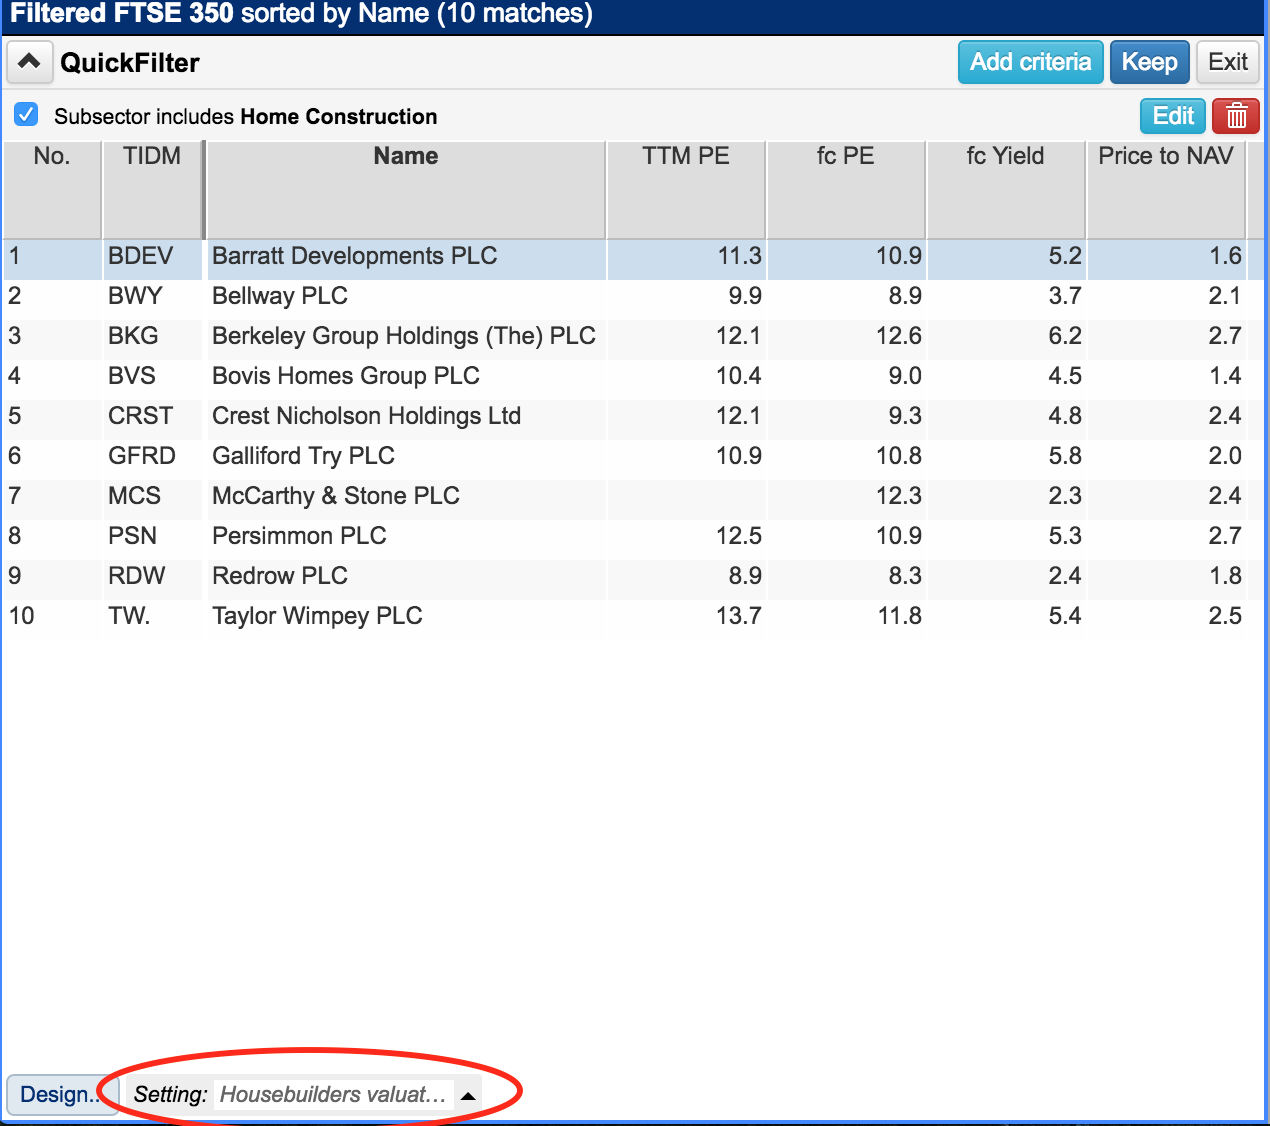
Now let's get on with analysing the housebuilding sector in SharePad.
Past performance
One of the first things I like to do when looking at a sector is to find out which shares have performed in the past. I want to know if I am potentially investing in a hot sector which is loved by investors or one that has been shunned and is unloved.
The best way to do this in SharePad is to add columns to the housebuilder portfolio that tell you the total shareholder returns (share price change plus dividends received) over different time periods. I've set this out in the table below.

SharePad makes it easy to see if a company has made money. A positive shareholder return is coloured green whereas a loss is coloured red.
What we can see here is that over a ten year period only shares in Taylor Wimpey have been a loss making investment. Over the last five years, most of the shares have produced some stunning returns for investors. Barratt Developments has returned 468% whilst Taylor Wimpey has done even better, returning 528%.
Over the last year the sector's performance has been more mixed. Barratt and Taylor Wimpey have led the way, but Bovis Homes and Galliford Try have lost money.
SharePad can also break down the total shareholder return between changes in price and dividends received. I find this really useful as dividends are an important part of your return as an investor. Unlike increases in share prices which can fall back, a dividend cannot be taken away from you once it has been paid.
We can see here that the dividend returns from the sector during the last year has been significant - the high yields are reflective of the special dividends paid by many Housebuilders on top of their annual dividends. We'll take a look at the sustainability of dividends later on.
All of Barratt Developments one year shareholder return has come from dividends paid. Just under half of Berkeley Group's has come from dividends.
When I see a sector that has performed so well over the last five years it's normal to think whether all the easy money has been made. To try and weigh up whether this might be the case you need to have a look to see if the shares are cheap or expensive.
Valuations
I've created a table to give me a snapshot of the valuation of the housebuilding sector. There are lots of different valuation options in SharePad for you to choose from. Here, I've kept things fairly simple by looking at price earnings (PE) ratios, price earnings growth (PEG) ratios, dividend yields, and price to net asset value (P/NAV).
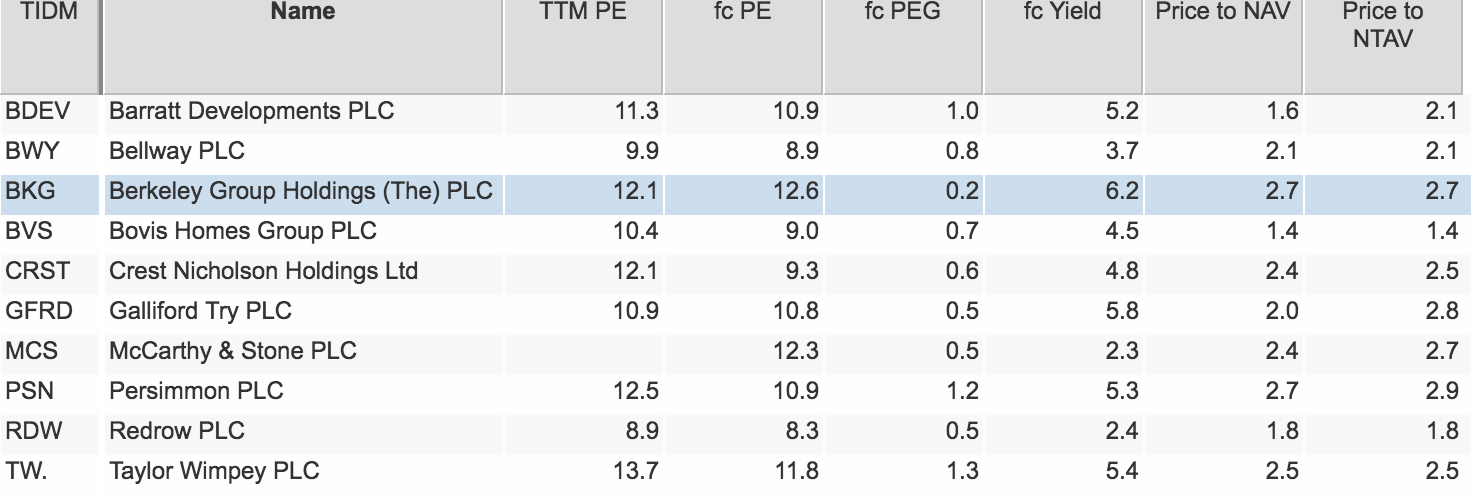
On a PE basis, the shares don't look particularly expensive at first glance with forecast PE ratios ranging from just over 8 times to just under 13. That said, housebuilders profits are cyclical and move from peaks to troughs. After a strong period of profits growth it would be surprising to see these shares trading on high PE ratios as most investors would expect growth to slow down. (For more on how to analyse cyclical sectors click here.)
The PEG ratio compares the forecast PE ratio with the expected rate of earnings per share growth. Many of the Housebuilders are trading at a PEG below 1.0 which is usually considered cheap. However, it is always worth remembering that analysts are very good at predicting the future especially in cyclical sectors which might suggest caution when using PEG ratios.
The sector is offering some very high forecast dividend yields which look very attractive compared with the yields on government bonds and the interest rates offered by savings accounts. However, caution is needed here too. Many of these companies are paying quite a small proportion of their profits as a regular annual dividend - an amount that can probably be sustained even if profits fall from current levels - and then topping this up with special dividends.
In the last recession, dividends were cut or scrapped entirely. This may explain why companies are paying special dividends whilst the going is good.
Many professional analysts value housebuilding shares by comparing the share price with the net asset value (NAV) per share. Using NAV makes sense when a company's assets can be turned into cash relatively quickly. In the case of a housebuilder, the bulk of its NAV will be made up of unsold houses already built and plots of land less any debts. Sometimes, the net tangible asset value (NTAV) per share is used which takes away the value of intangible assets such as goodwill.
During bad times, when the housing market is depressed, house builder shares can be bought for less than their NAV per share. When times are good and investors are optimistic about the prospects for future profits growth the shares can change hands at significantly more than NAV per share.
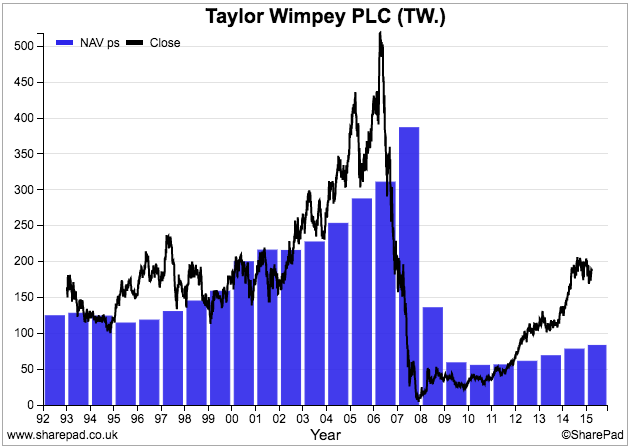
When looking at an individual housebuilding company you should look at the history of its P/NAV valuation and see where the shares are trading relative to its historic range. If it is at the low end and the outlook is good then that might indicate a potential buying opportunity. A valuation at the high end might signal that shares might not offer much profit potential.
The history of Taylor Wimpey's share price compared with its NAV per share is shown in the chart below. As you can see, its shares are currently changing hands for considerably more than its NAV which is telling us that the shares are very popular with investors at the moment. The same is true for most of the sector.
I'll have a lot more to say on P/NAV later when I'll show you how to try and work out the right P/NAV multiple for a house builder.
Financial Performance
Studying a company's financial history is very important - even more so for a cyclical sector such as housebuilding. In the table below, I've asked SharePad to give me data on three key measures of a company's financial performance - ROCE, ROE and EBIT margin - and compare them with their ten year average figures.
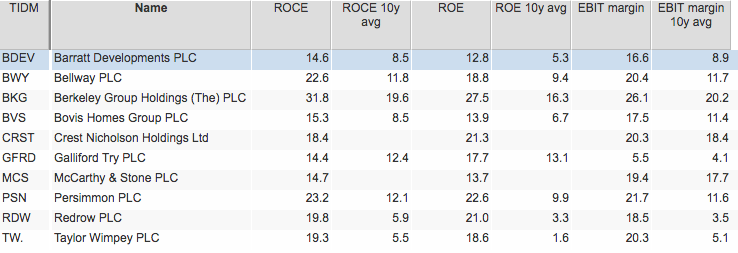
As you can see, on all three measures, all the companies have figures that are above their ten year average. I've no idea whether the past will repeat itself but the chances are that the sector will have another slump sometime in the future. If this comes to pass, then these measures above are telling me that the sector is nearer a peak than a trough in profitability.
As an aside, Berkeley Group is the most profitable company in the sector on these three key financial performance measures.
We can now look at these measures in more detail.
Sector Profit Margins
SharePad allows you to look at a financial performance measure across a sector for the last ten years. Here we are comparing each company's current EBIT margin with its ten year history. This allows us to see the performance of companies throughout an economic cycle where profits boomed, slumped (in 2008-09) and have then recovered again.

As you can see, most companies have EBIT margins that are higher than or close to their previous peaks. For all I know, these margins could go higher and be sustainable for many years ahead. What you can take away from this is that housebuilders are currently doing very well compared with history.
A similar pattern is repeated when looking at ROCE, although Barratt and Redrow still have ROCEs which are considerably lower than the last peak ten years ago. There may be good reasons for this such as different business conditions or it may be a sign that their profits still have some room for improvement.

Barratt is again some way below its peak ROE, although many of its peer are close to or above their ten year highs on this measure. I'll have more to say on ROE in a little while as it has a big say on the valuation of housebuilders.

Free cash flow margin
Free cash flow performance is more patchy. However, we can see that many of these companies are turning more of their turnover into free cash flow - the free cash flow margin - which again is a sign of them being nearer a peak rather than a trough in financial performance.

Net debt to EBITDA
Debt levels, as measured by the net debt to EBITDA, are very low and have been improving. Most companies look to have very strong finances.

As with all companies, you need to be aware that the amount of debt on a balance sheet is only a snapshot on one day of its financial year. Average net debt levels throughout the year are often higher (How much debt and cash does a company really have?). Some builders often buy land on credit. Barratt Developments has nearly £1bn of land creditors which are not accounted for as debt but in reality they are a form of debt. The company, to its credit, is very open about this in its annual report.
What's the right value for housebuilder shares?
I mentioned earlier that many professional analysts value the shares of housebuilders using multiples of price to NAV per share (P/NAV). But how do you work out what is the right multiple?
I'll explain how you can try and work this out for yourself. This is a little more advanced but stay with me on this and hopefully you'll understand what I am going on about.
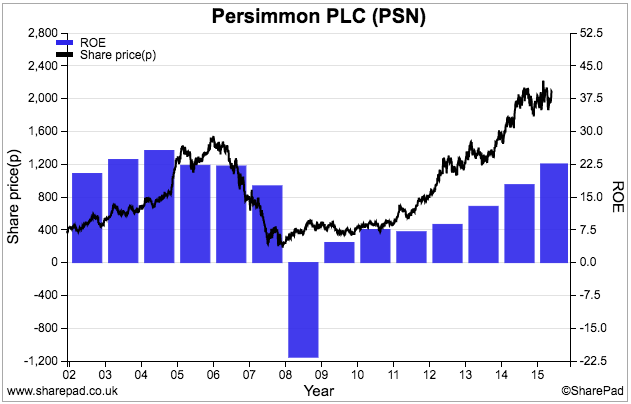
As you can see from the chart below, there is a relationship between a company's return on equity (ROE) and its share price. Share prices tend to rise when ROEs are rising and vice versa.
The rising share price also results in a higher P/NAV - i.e. the gap between the share price and NAV per share tends to get bigger. This is shown in the chart below:
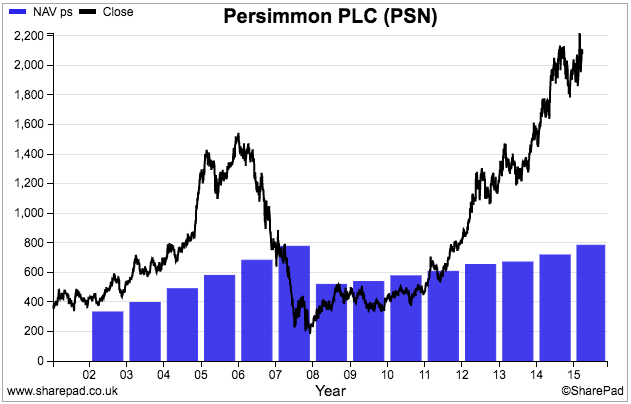
This makes sense. Just like a savings account with a higher rate of interest, a company with a higher ROE is likely to grow in value faster than one with a lower ROE or interest rate. It stands to reason that it should have a higher valuation and higher P/NAV multiple.
Professional investors try and determine the right P/NAV multiple for a share by estimating a company's sustainable return on equity and comparing it with the returns required by shareholders to invest in the company - known as the cost of equity (COE).
This cost of equity is one of the most hotly debated topics in finance. There's no right answer to what number it should be. I'm not going to get into this topic right now but most professional investors assume that it is around 8%.
Getting back to the P/NAV multiple, the logic here is that a share is only worth its NAV per share if the company can produce an ROE that is equal to or more than the cost of equity. So if the sustainable ROE is 8% then the estimated P/NAV is worked out by dividing the ROE by the COE:
P/NAV = ROE/COE = 8%/8% = 1.0
If the sustainable ROE was 16% the P/NAV would be:
16%/8% = 2.0
If the sustainable ROE was only 4% then it would be:
4%/8% = 0.5
So we now have some simple rules:
- ROE > COE then P/NAV > 1.0
- ROE = COE then P/NAV = 1.0
- ROE < COE then P/NAV < 1.0
So if you were looking at a share with a sustainable ROE of 12%, a cost of equity of 8% and a NAV per share of 100p, this is how you would work out a value for the share:
Implied P/NAV = 12%/8% = 1.5
Value per share = NAVps x P/NAV = 100p x 1.5 = 150p
You get a value by multiplying the NAV per share by the estimated P/NAV.
This approach contains an important lesson for investors. A share with a P/NAV of less than 1 is sometimes seen as being cheap. It might not be if it cannot make a sustainably high ROE. Bargains do exist when ROE is temporarily depressed and can recover from a low to sustainably higher average levels in the future.
So how do we go about valuing housebuilders using this method. This is not easy because of the up and down nature of the sector with periodic boom and bust. Estimating a sustainable ROE is not easy. So I've looked at three different scenarios assuming a required return or cost of equity of 8% throughout.
Current ROE's are sustainable forever
| Name | ROE | Implied P/NAV | NAV ps | Implied Price(p) | Close(p) | Upside/Downside |
|---|---|---|---|---|---|---|
| Barratt Developments PLC | 12.8 | 1.6 | 367.2 | 587.5 | 584.5 | 0.52% |
| Bellway PLC | 18.8 | 2.35 | 1284.5 | 3018.6 | 2,676.00 | 12.80% |
| Berkeley Group Holdings (The) PLC | 27.5 | 3.44 | 1210.6 | 4161.4 | 3,241.00 | 28.40% |
| Bovis Homes Group PLC | 13.9 | 1.74 | 712.5 | 1238 | 991.5 | 24.86% |
| Crest Nicholson Holdings Ltd | 21.3 | 2.66 | 245.9 | 654.7 | 586 | 11.73% |
| Galliford Try PLC | 17.7 | 2.21 | 683.9 | 1513.1 | 1,369.00 | 10.53% |
| McCarthy & Stone PLC | 13.7 | 1.71 | 100.8 | 172.6 | 239.5 | -27.92% |
| Persimmon PLC | 22.6 | 2.83 | 783.1 | 2212.3 | 2,084.00 | 6.15% |
| Redrow PLC | 21 | 2.63 | 232.6 | 610.6 | 420 | 45.38% |
| Taylor Wimpey PLC | 18.6 | 2.33 | 83 | 193 | 204.5 | -5.64% |
If we take the current ROEs - which are close to peak values for many in the sector - then some of the shares are undervalued on this method. Persimmon shares look fully valued and Taylor Wimpey shares are slightly overvalued. That said, this analysis seems to be telling us that quite high ROEs - higher than historical averages - have been factored into current share prices.
But what if these returns aren't sustainable, which history suggests they are not.
Valuations based on 5 year average ROEs
| Name | ROE 5y avg | Implied P/NAV | NAV ps | Implied Price | Close | Upside/Downside |
|---|---|---|---|---|---|---|
| Barratt Developments PLC | 6.4 | 0.8 | 367.2 | 293.8 | 584.5 | -49.74% |
| Bellway PLC | 10.9 | 1.3625 | 1284.5 | 1750.1 | 2,676.00 | -34.60% |
| Berkeley Group Holdings (The) PLC | 17.9 | 2.2375 | 1210.6 | 2708.7 | 3,241.00 | -16.42% |
| Bovis Homes Group PLC | 8.6 | 1.075 | 712.5 | 765.9 | 991.5 | -22.75% |
| Crest Nicholson Holdings Ltd | 24.8 | 3.1 | 245.9 | 762.3 | 586 | 30.08% |
| Galliford Try PLC | 12 | 1.5 | 683.9 | 1025.9 | 1,369.00 | -25.07% |
| McCarthy & Stone PLC | 0 | 100.8 | N/A | 239.5 | N/A | |
| Persimmon PLC | 13.8 | 1.725 | 783.1 | 1350.8 | 2,084.00 | -35.18% |
| Redrow PLC | 11.5 | 1.4375 | 232.6 | 334.4 | 420 | -20.39% |
| Taylor Wimpey PLC | 12.4 | 1.55 | 83 | 128.7 | 204.5 | -37.09% |
Based on the average ROE of the last five years when profits and ROE have generally been increasing all the shares with the exception of Crest Nicholson look overvalued.
Valuations based on 10 year average ROEs
Based on ten year average ROE's which take into account the last recession of 2008-09 the shares look very overvalued.
| Name | ROE 10y avg | Implied P/NAV | NAV ps | Implied Price | Close | Upside/Downside |
|---|---|---|---|---|---|---|
| Barratt Developments PLC | 5.3 | 0.66 | 367.2 | 243.3 | 584.5 | -58.38% |
| Bellway PLC | 9.4 | 1.18 | 1284.5 | 1509.3 | 2,676.00 | -43.60% |
| Berkeley Group Holdings (The) PLC | 16.3 | 2.04 | 1210.6 | 2466.6 | 3,241.00 | -23.89% |
| Bovis Homes Group PLC | 6.7 | 0.84 | 712.5 | 596.7 | 991.5 | -39.82% |
| Crest Nicholson Holdings Ltd | 0 | 245.9 | N/A | 586 | N/A | |
| Galliford Try PLC | 13.1 | 1.64 | 683.9 | 1119.9 | 1,369.00 | -18.20% |
| McCarthy & Stone PLC | 0 | 100.8 | N/A | 239.5 | N/A | |
| Persimmon PLC | 9.9 | 1.24 | 783.1 | 969.1 | 2,084.00 | -53.50% |
| Redrow PLC | 3.3 | 0.41 | 232.6 | 95.9 | 420 | -77.16% |
| Taylor Wimpey PLC | 1.6 | 0.2 | 83 | 16.6 | 204.5 | -91.88% |
Remember, this is just an overview of the sector. To work out whether the shares are worth buying or not you should do some in-depth research into the company. For more, check out my article on Taylor Wimpey here.
To sum up
- You can do in-depth financial analysis of sectors in SharePad.
- It is easy to study lots of different trends going back 10 years.
- Housebuilder shares have made investors a lot of money during the last five years but have been more subdued during the last year.
- The profits and financial returns of housebuilders are close to their previous peaks.
- Price to NAV is arguably the best way to value a housebuilder.
- There is a strong relationship between a company's return on equity (ROE) and its P/NAV multiple.
- An estimated P/NAV multiple can be found by dividing the ROE by the required return needed by shareholders (cost of equity).
- Estimating sustainable ROE can be difficult.
- Current share prices of housebuilders seem to be implying that the current high ROE can be sustained forever. This suggests that using current ROE isn't the best way to calculate valuations.
- If you believe that the housebuilding sector will continue to be cyclical, the sector looks expensive using 5 year and 10 year average ROEs.
If you have found this article of interest, please feel free to share it with your friends and colleagues:
We welcome suggestions for future articles - please email me at analysis@sharescope.co.uk. You can also follow me on Twitter @PhilJOakley. If you'd like to know when a new article or chapter for the Step-by-Step Guide is published, send us your email address using the form at the top of the page. You don't need to be a subscriber.
This article is for educational purposes only. It is not a recommendation to buy or sell shares or other investments. Do your own research before buying or selling any investment or seek professional financial advice.