The Cash view
The Cash view shows details of all of the credits and debits that have been recorded over the lifetime of your portfolio.
To access the Cash view:
- To begin, select the appropriate portfolio using the blue Port button on the blue side of the screen.
- Once you have selected a portfolio, you will see that the dark green Trans button is selectable - clicking on this will open the Transactions view. Note that the Trans button will also turn white, indicating that this is the current view.
- From here you can click the pale green Cash button.

Credits are recorded in the cash account in one of the following ways:
- Recording a credit transaction
- Recording a sell transaction
- Recording a dividend transaction
- Recording a return of capital transaction
Debits are recorded in the cash account in one of two ways:
- Recording a debit transaction
- Recording a buy transaction

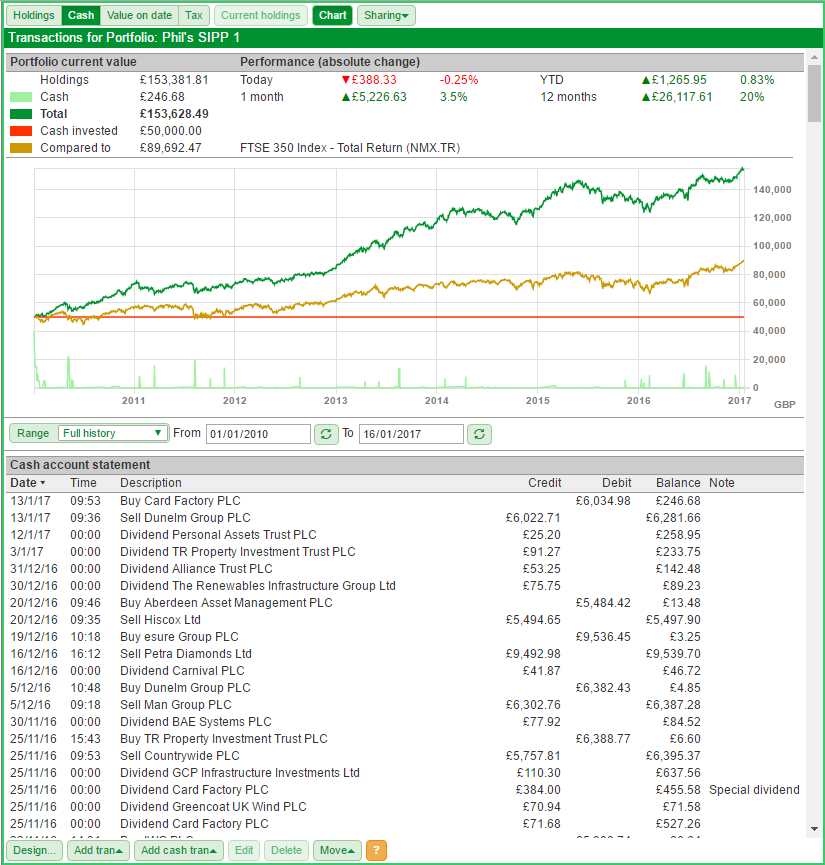
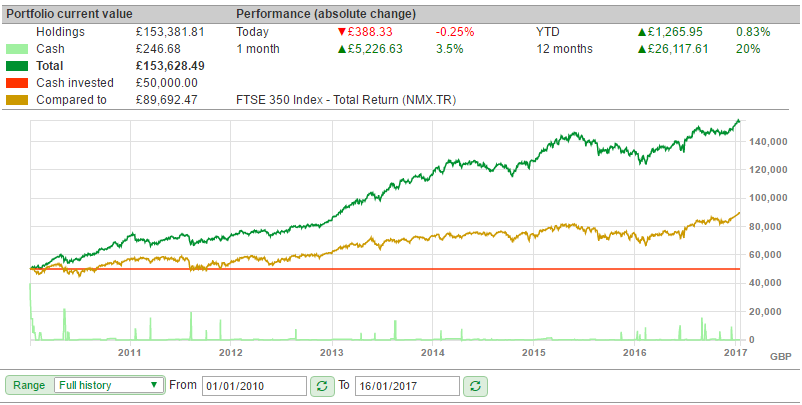
At the top of the Cash view is the same summary view which can be found on the Holdings view. This shows the current value of the portfolio and the performance of the portfolio over various time periods.
On the left-hand side, there is a breakdown of the value of the portfolio. It shows the value of the Holdings, Cash, and also the Total value.
If you have selected to draw a comparative line on the chart, this will show how the investment would have performed had you invested your cash position into that instrument instead. In this example, the portfolio has strongly outperformed the FTSE 350 Total Return index.
In addition, you can also select the option to show how much cash has been invested into the portfolio. In the above example, the portfolio started with an initial credit of £50,000.
Below the summary is a chart of the portfolio's performance. For more information about how to use the chart, please click here.
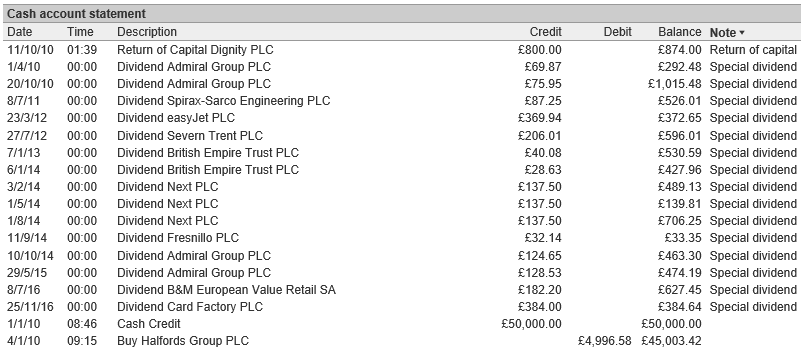
Below the chart is the Cash table, which shows the record of your credits and debits.

This can be sorted by any of the columns shown on the table. For example, you might want to sort the table by the Note column. Any transaction can have a note applied to it. In this case the Special Dividend notes have been applied by the Automatic dividend process and the Return of Capital note entered when manually recorded.

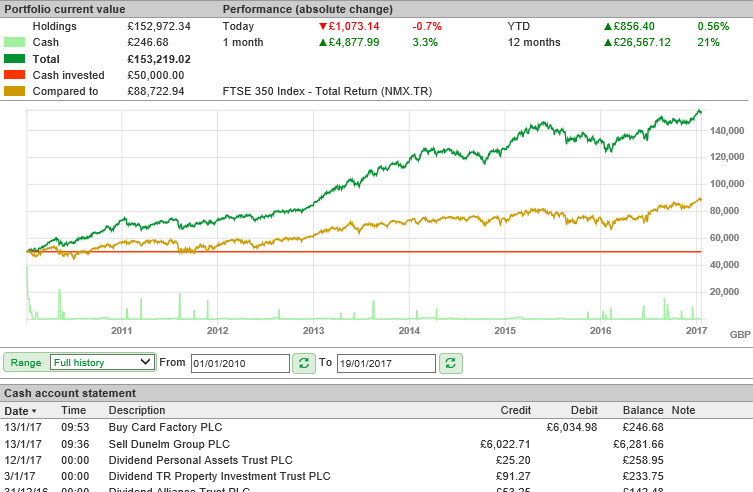
When sorted by Date, the balance column shows how the balance of the cash has changed with every credit and debit and so will also show your current cash balance. This value is also visible on the summary section at the top of the screen.