Compare ShareScope & ShareScope Pro
ShareScope and ShareScopePro are all-in-one platforms for private investors and traders alike. While they share a common name and many common features there are distinct differences.
The 7 main differences between ShareScope and ShareScope Pro
Below is a short article and a like-for-like comparison table. By the end of both you will have a clearer understanding of which subscription aligns with your specific needs, ensuring that you make the most of your investment journey. As ever, if you have any further questions, the support team are just a call, email or message away.
1. Live, real-time data
ShareScope Pro provides users with live, real-time data for the UK & US markets. There are also live data feeds for AQSE, Investment Trusts, ETFs, Coprorate Bonds, Global Indices, Foreign Exchange, Commodity spot prices and Covered warrants, These compare to 15-minute delayed data for ShareScope.
Real-time data is crucial for swift decision-making and risk management. It provides real-time information on market conditions, prices, and news, allowing traders to respond promptly to opportunities and threats.
2. UK LSE & AQSE Level 2
ShareScope Pro's Level 2 feature enables users to access real-time information about stocks listed on the London Stock Exchange (LSE) and AQUIS exchange (AQSE). This functionality provides details on buying (bid) and selling (ask) prices, as well as the volume of orders at various price levels.
Using Level 2, you can dive into detailed and summarised orders, revealing the volume at each price level. You can also refine your search to see specific details like price, time, volume, and type.
Level 2 also includes a visual display of orders and volumes, making it easier to spot potential support and resistance levels.
To learn more about ShareScope Pro's Level 2 view and how to use it, read our detailed written tutorial The Level 2 View or watch this 4 minute tutorial video via our YouTube channel.

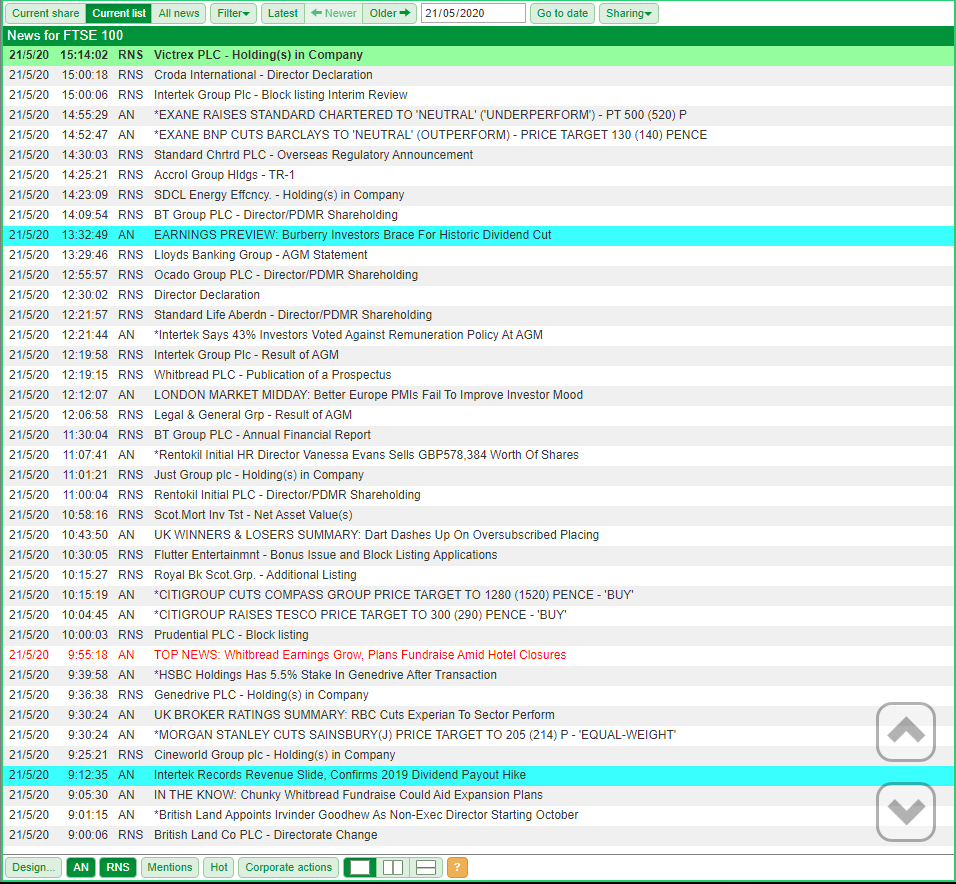
3. Alliance News Professional
Both ShareScope and ShareScope Pro provide comprehensive news coverage for the UK & US markets through RNS, Alliance News and MT Newswires. ShareScope Pro extra coverage with Alliance News Professional - the complete real-time news service for UK financial professionals. On top of the Alliance News Investor service delivered to ShareScope, ShareScope Pro receives an additional 275 articles per day including the following additions for deeper news coverage:
- News for the top 150 global blue-chip companies
- Earnings previews
- CEO Interviews and In depth articles
- Extra reporting on key stories
- London Main Market and AIM IPO scorecards
- In the Know - share-movers and special situations
- Taking AIM - small-cap insight
- Top global economic, political & general news
- Top global economic events calendar - next 7 days
- Central bank meeting previews
- Major economy comparative indicators
In addition, the Professional level of Alliance News provides unlimited access to the Alliance News archive compared to an archive of the last 4 months of Alliance News in ShareScope.
4. Floating windows for multi-monitor display
ShareScope users are able to create split screen and multi-window layouts whereas ShareScope Pro enables you to have ShareScope set up a across multiple monitors too.
Click, drag, and position windows wherever you want with the added convenience of cross-monitor support. Whether you have 1 monitor or 8, ShareScope handles it like a Pro.
To learn more about ShareScope Pro's Floating windows and how to set it up, watch this 3 minute tutorial video via our YouTube channel.
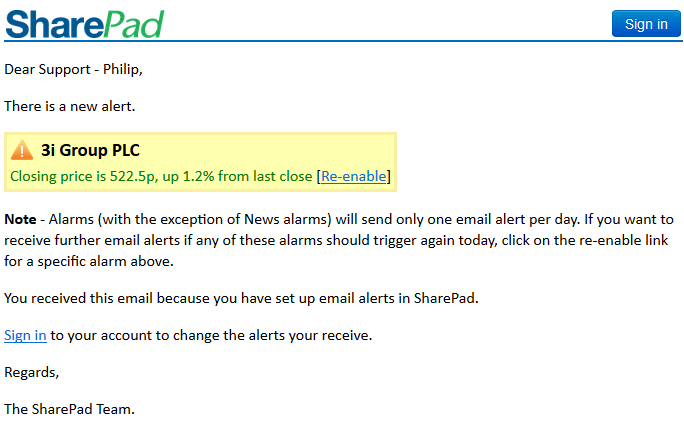
5. More alarms
Alarms keep you on top of the game, even when away from your computer. Whether it be a stop-loss or a change in broker consensus.
ShareScope supports 500 active alarms, and ShareScope Pro offers 1000 alarms.
To learn more about ShareScope's alarms and how to use them, read our detailed written tutorial Alarms
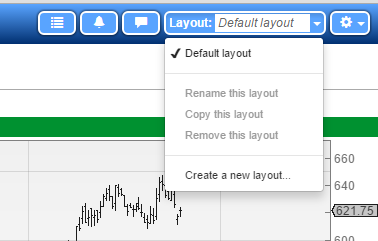
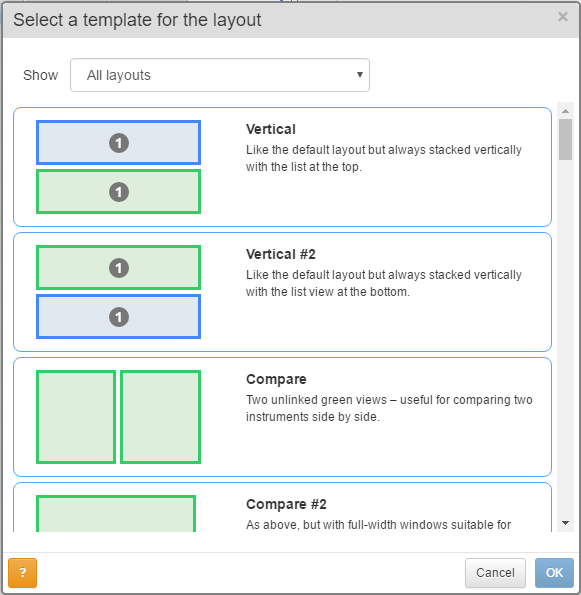
6. Download more layout templates
Both ShareScope and ShareScope Pro come equipped with over 50 multi-window layout templates.
ShareScope provides space to download a total of 8 templates, while ShareScope Pro offers an expanded limit of 16. These downloaded templates allow the flexibility to quickly switch between a number of different layouts at the click of a button.
7. Cost
The great thing about live, real-time pricing information is its instantaneous and allows you to react quickly to changing market conditions. The downside of real-time is that the exchanges charge a great deal more for these data feeds.
The live data feeds in ShareScope Pro coupled with UK Level 2 access as well as the additional features above, mean the monthly subscription is �81 per month compared to �35 per month for ShareScope.
Comparison table
Overview |
Subscribe |
Subscribe |
|---|---|---|
| Total monthly subscription | �36 | �84 |
| Access online anywhere | Yes | Yes |
| Compatibility | PC, Laptop, Mac, Tablet, Mobile | PC, Laptop, Mac, Tablet, Mobile |
| Format | Multi-window | Multi-window & Multi-monitor |
| Price updates* | Delayed | Live |
| News updates** | Yes | Yes |
| Stock analysis | 5 | 5 |
| Fund analysis | 5 | 5 |
| Charting & TA | 5 | 5 |
| Stock-screening | 5 | 5 |
| Technical filtering | 5 | 5 |
| Alarms | 5 | 5 |
| Portfolio management | Yes | Yes |
| Telephone & email support | 5 | 5 |
| Multi-window downloadable templates | 8 | 16 |
| * Daily means after market close (e.g. 6pm UK); Delayed means all prices update continuously, but lag 15 minutes behind Live data. | ||
| ** See 'News updates' section below for more detail on types of news available. | ||
Price updates |
||
| LSE Level 1 | Delayed | Live |
| LSE Level 2 | No | Live |
| US stock markets | Delayed | Live |
| European stocks (CBOE Europe) | Delayed | Delayed |
| Canadian stock markets | Delayed | Delayed |
| AQSE Level 1 | Delayed | Live |
| AQSE Level 2 | No | Live |
| Global indices | Delayed * | Live * |
| Foreign exchange | Delayed | Live |
| Cryptocurrencies | Live | Live |
| Commodity futures | Daily | Daily |
| Commodity spot prices | Delayed | Live |
| Covered warrants | Delayed | Live |
| Funds | Daily | Daily |
| Investment trusts | Delayed | Live |
| Exchange traded funds (ETFs) | Delayed | Live |
| Gilts | Daily | Daily |
| Corporate bonds | Delayed | Live |
| Economic data | Daily | Daily |
| * Some global indices are daily or delayed. | ||
News updates |
||
| RNS | Live | Live |
| MT Newswires (US & CAN) | Live | Live |
| Alliance News | Live | Live |
| Alliance News coverage level | Investor | Professional |
| Alliance News - articles per day | 125 | 400 |
Charts |
||
| Price charts | Yes | Yes |
| Intraday price charts | Yes | Yes |
| Trade data | Yes | Yes |
| Technical analysis | 5 | 5 |
| Annotate charts | Yes | Yes |
Stock Screening |
||
| By fundamentals | Yes | Yes |
| By technicals | Yes | Yes |
| By sector ranking | Yes | Yes |
| Custom calculations | Yes | Yes |
| "Guru" filters | Yes | Yes |
| Phil Oakley filters | Yes | Yes |
Portfolio Management |
||
| Unlimited portfolios | Yes | Yes |
| Group portfolios | Yes | Yes |
| Portfolio currency | Single | Single |
| Record transactions | Yes | Yes |
| Cash account(s) | Yes | Yes |
| Portfolio chart | Yes | Yes |
| CGT management | Yes | Yes |
| Dividend reports | Yes | Yes |
Investor tools |
||
| Target price calculator | Yes | Yes |
| Earnings power value (EPV) | Yes | Yes |
| Dividend-based valuation | Yes | Yes |
| Discounted cash flow valuation | Yes | Yes |
| Share buybacks | Yes | Yes |
| Lease-adjusted ratios | Yes | Yes |
Alarms |
||
| Total number of active alarms | 500 | 1000 |
| Individual stock alarms | Yes | Yes |
| Email alerts | Yes | Yes |
| Price change alarms | Yes | Yes |
| Line alarms | Yes | Yes |
| Stop loss/gain alarms | Yes | Yes |
| News alarms | Yes | Yes |
| Price growth alarms | Yes | Yes |
| Director buy/sell alarms | Yes | Yes |
| Dividend alarms | Yes | Yes |
| Dividend forecast alarms | Yes | Yes |
| Profit forecast alarms | Yes | Yes |
| Broker consensus alarms | Yes | Yes |
| Technical alarms | Yes | Yes |
| Unscheduled auction alarm | No | Yes |
Import/Export data |
||
| Export tables | Yes | Yes |
| Export charts | Yes | Yes |
| Export price series | Yes | Yes |
| Export trade data | Yes | Yes |
| Import data | Yes | Yes |
Chart types (historical) |
||
| Close Line | Yes | Yes |
| OHLC bars | Yes | Yes |
| Candlestick | Yes | Yes |
| Candlestick patterns | Yes | Yes |
| Heikin-Ashi | Yes | Yes |
| Ichimoku charts | Yes | Yes |
| Parabolic SAR | Yes | Yes |
| Pivot points | Yes | Yes |
| Point & figure | Yes | Yes |
| Price/Donchian channels | Yes | Yes |
| Stop-loss/Stop-gain | Yes | Yes |
| Zigzag charts/lines | Yes | Yes |
Chart types (intraday) |
||
| Mid line | Yes | Yes |
| Close line | Yes | Yes |
| Candlestick | Yes | Yes |
| Heikin-Ashi | Yes | Yes |
| OHLC | Yes | Yes |
| Pivot points | Yes | Yes |
| Point & figure | Yes | Yes |
| Price/Donchian channels | Yes | Yes |
| Stop loss/gain | Yes | Yes |
Moving averages |
||
| Simple moving average | Yes | Yes |
| Exponential moving average | Yes | Yes |
| Weighted moving average | Yes | Yes |
| Triangular moving average | Yes | Yes |
| Variable moving average (VHF) | Yes | Yes |
| Variable moving average (CMO) | Yes | Yes |
| VIDYA moving average | Yes | Yes |
| Bollinger bands | Yes | Yes |
| Envelopes (Trading bands) | Yes | Yes |
| Keltner channels | Yes | Yes |
| STARC bands | Yes | Yes |
Indicators (historical) |
||
| Accumulation/distribution | Yes | Yes |
| Adaptive stochastic oscillator | Yes | Yes |
| Aroon | Yes | Yes |
| Average true range (ATR) | Yes | Yes |
| Beta | Yes | Yes |
| Chande momentum oscillator | Yes | Yes |
| Chande trend index | Yes | Yes |
| Commodity channel index (CCI) | Yes | Yes |
| Coppock momentum | Yes | Yes |
| Correlation | Yes | Yes |
| Directional movement (ADX) | Yes | Yes |
| Ease of movement | Yes | Yes |
| Elder Force Index | Yes | Yes |
| MACD | Yes | Yes |
| Mass index | Yes | Yes |
| Meisels | Yes | Yes |
| Momentum | Yes | Yes |
| Money flow index | Yes | Yes |
| On balance volume | Yes | Yes |
| Oscillator | Yes | Yes |
| Other share or index | Yes | Yes |
| Price relative to | Yes | Yes |
| RSI | Yes | Yes |
| Standard deviation | Yes | Yes |
| Stochastic oscillator | Yes | Yes |
| Trend analysis | Yes | Yes |
| TRIX | Yes | Yes |
| Ultimate oscillator | Yes | Yes |
| Vertical horizontal filter (VHF) | Yes | Yes |
| Volatility | Yes | Yes |
| Volume | Yes | Yes |
| Williams %R | Yes | Yes |
| Williams Acc/Dist | Yes | Yes |
| Williams accelerator | Yes | Yes |
| Williams awesome oscillator | Yes | Yes | Indicators (intraday) |
| Accumulation/distribution | Yes | Yes |
| Aroon | Yes | Yes |
| Average true range (ATR) | Yes | Yes |
| Beta | Yes | Yes |
| Chande momentum oscillator | Yes | Yes |
| Chande trend index | Yes | Yes |
| Commodity channel index (CCI) | Yes | Yes |
| Correlation | Yes | Yes |
| Directional movement (ADX) | Yes | Yes |
| Elder Force Index | Yes | Yes |
| MACD | Yes | Yes |
| Momentum | Yes | Yes |
| On balance volume | Yes | Yes |
| Oscillator | Yes | Yes |
| Other share or index | Yes | Yes |
| Price relative to | Yes | Yes |
| RSI | Yes | Yes |
| Standard deviation | Yes | Yes |
| Stochastic oscillator | Yes | Yes |
| Trend analysis | Yes | Yes |
| TRIX | Yes | Yes |
| Ultimate oscillator | Yes | Yes |
| Vertical horizontal filter (VHF) | Yes | Yes |
| Volatility | Yes | Yes |
| Volume index | Yes | Yes |
| Williams %R | Yes | Yes |
| Williams Acc/Dist | Yes | Yes |
| Williams accelerator | Yes | Yes |
| Williams awesome oscillator | Yes | Yes |
Line studies |
||
| Fibonacci retracement | Yes | Yes |
15 mins delayed prices, live news |
|---|
- Everything in one place for Private Investors
- UK, US, CAN & EU stocks (all included as standard)
- Funds, investment trusts, exchange traded funds (ETFs)
- Global market indices, commodities, bonds, forex and cryptocurrencies
- Live UK news, RNS & alarms | Live US & CAN news & alarms
- Unrivalled filtering & stock screening
- Superior, unlimited portfolio management with analysis including x-ray
- Use anywhere - Windows PCs & laptops, MacBooks, iPads, Android tablets, mobile
- A huge suite of financial, charting and technical analysis tools
- Book FREE one-to-one training with an expert to use the program to your full advantage as quickly as possible.
Live prices, live news, LSE Level 2, floating windows for multi-monitors |
|---|
- Everything in one place for Traders
- Everything in ShareScope
- Live, real-time UK prices
- Live, real-time US prices
- Live, real-time AQSE, ITs, ETFs and Corporate Bonds
- Live, real-time Global Indices, FX, Commodity spots and Covered warrants
- Level 2 for London Stock Exchange
- Level 2 for Aquis (AQSE)
- Floating windows for multi-monitor display
- Alliance News Professional (including 275 more articles a day)
- More alarms
- More downloadable layout templates
Plus...

