Tutorial: Columns
In ShareScope you can click on Help and access a series of tutorials that give you an overview of the way the program works. This training zone article is designed to complement these tutorials, but also offer more detail than they are able to.
This tutorial covers the following column operations:
Selecting and deselecting a column
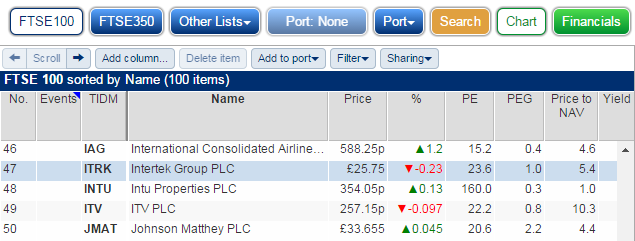
In ShareScope, when a column is not selected, the table will appear as follows:
You can select a column by clicking or tapping on the heading of that column. When you do so the column will change colour and a red circular button will appear on the right-hand side of the heading.
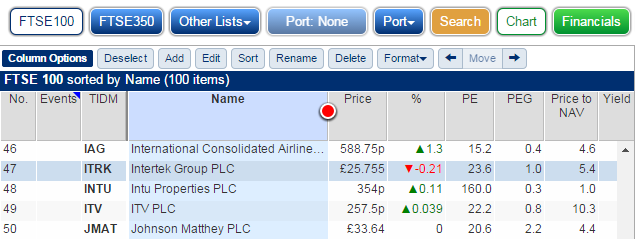
The blue toolbar will also change and give you a series of Column Options. If you wish to return to the previous toolbar so that you can select the Filter button, for example, then you just need to click on the  button.
Adjusting the column width and moving a column
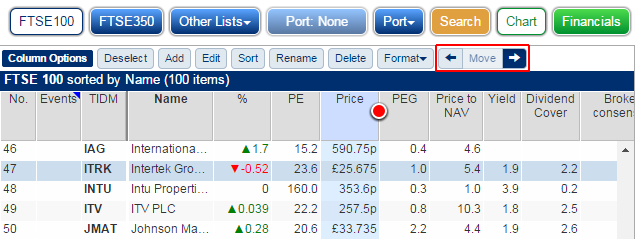
You can use the red button, which appears to the right of the column heading, to adjust the column width. To do so drag it either by using the mouse or your finger and the column will be adjusted accordingly.
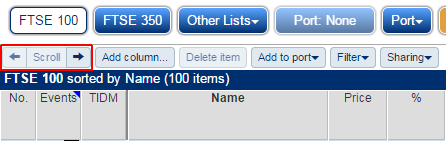
If you want to change the placing of a column you can use the Left and Right move arrows.
Fixed columns and scrolling the columns
A number of columns on the table are always fixed in place; this means they will always be visible on the left-hand side of the table. You can see that there is a thicker border between the fixed columns and the rest of the columns in the table.
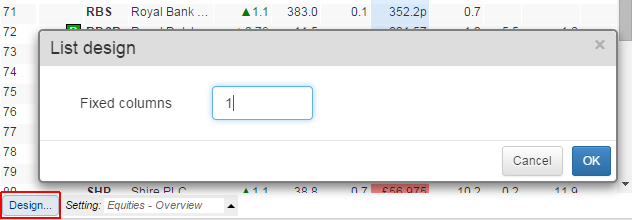
You can change the number of fixed columns by clicking on the Design... button at the bottom left of the ShareScope screen. Note: there has to be at least 1 fixed column.
The reason there are a number of fixed columns is because the rest of the columns can be scrolled left and right.
There are two ways to achieve this. If you deselect the current column you can use the scroll left and right arrows to scroll the columns.
You can also click and hold the left mouse button on a column heading and move the mouse left or right or, on a tablet or touch screen, drag a column heading left or right with your finger.
The blue triangle flag
You may have noticed that the Events column has a blue triangle in the upper right corner of its heading.
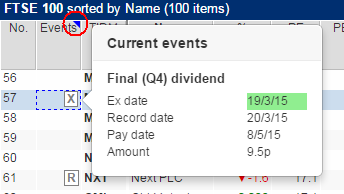
This means that the items in the column can present you with additional information in the form of a tooltip. To see the tooltip, select the share's row first then click on the Event column cell for that share and the tooltip will pop-up. In the example you can see, from the X event marker, that the share in question has just gone ex-div. The tooltip then shows you when that was, the record date and when and how much money will be paid by the dividend.
Sorting the list by a particular column
You can sort by any column in ShareScope. To do so, select the column, so that you can see the circular red button then click on the  button. This will sort the column for you. Columns like the Name column will be sorted Alphanumerically. Numerical columns like PE will be sorted highest to lowest. Date columns are sorted from future to past.
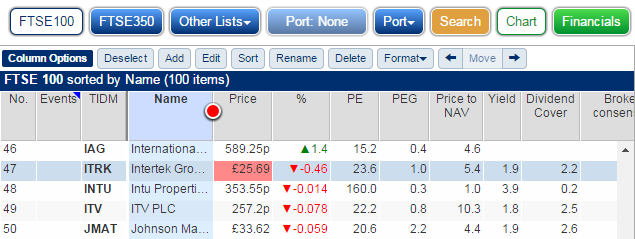
When you sort by a column the heading of the table will indicate which column the table is sorted by and the column heading will be shown in a bold typeface.
To reverse sort a column click on the Sort button again.
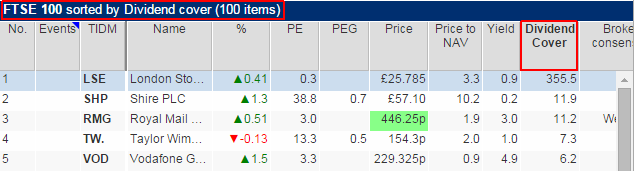
In this example the FTSE 100 list is being sorted by the Dividend Cover column.
Renaming a column
You can rename a column if you wish, to do so click on the  button.
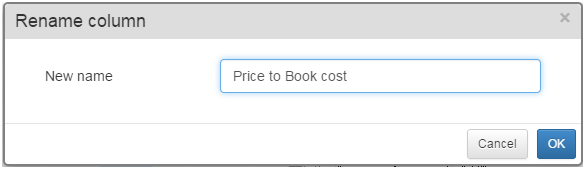
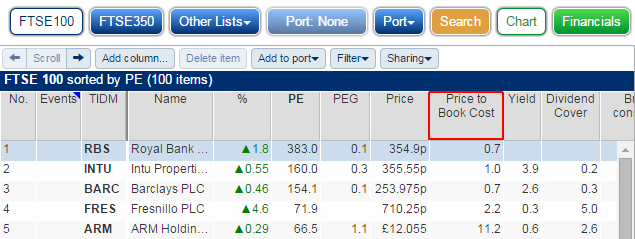
For example many people know Price to NAV as Price to Book cost and so may wish to change the name of that particular column.
To return a column heading to its original name select the column click on the  button and then click on OK.
If you wish to delete a column then select it, so that you can see the red button, and click on the  button. Note: there is no warning when you click on delete. However, if you do delete a column by mistake it is easy to add columns to a table.
Adding a column to a table
There are two methods which you can use to add a column to a table:
1. If you do not have a column selected you can click on the  button.
When you select this option you have both an OK and an Add button at the bottom of the Add Column dialog window. OK adds the column and closes the dialog. Add adds the column but leaves the dialog open so that you can add further columns to your table.
2. When you have a column selected you can click on the  button.

The difference between the two is where the column ends up being added. With no column selected you add the new column to the end of your table. With a column selected you can opt to insert the column to either the left or the right of the selected column.
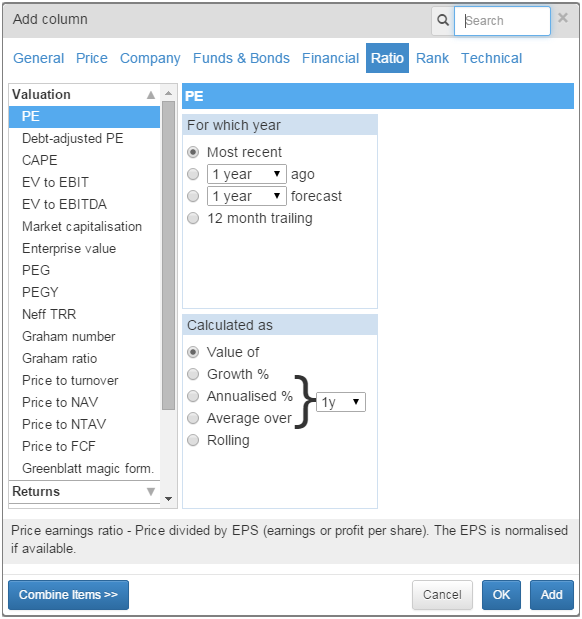
At the top of the Add column window you have a series of column types such as General, Price, Financial etc. Within these on the left-hand side of the screen you will see collapsible menus and on the right-hand side of the screen you will see additional options for the selected column if any are available.
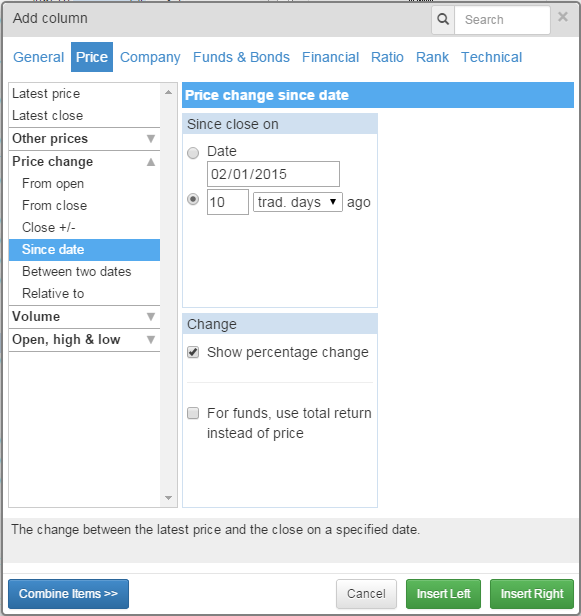
In this example we have selected Price at the top of the screen, then Price change and finally Since date. You can see on the right-hand side of the screen I can choose between the Price change since a specified date or a number of trading days ago. It is also possible to change trading days to weeks, months or years.
In addition to this, the option Show percentage change is ticked, if I untick this then the column will show the actual change in the share's price. The other available option lets me show the change in the total return for funds instead of the change in the price.
There are over 320 column types in ShareScope in over 40 different categories to make it easier to find the column you are looking for the Add Column dialog has a search function.
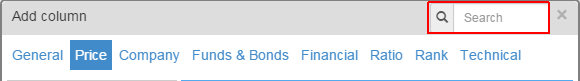
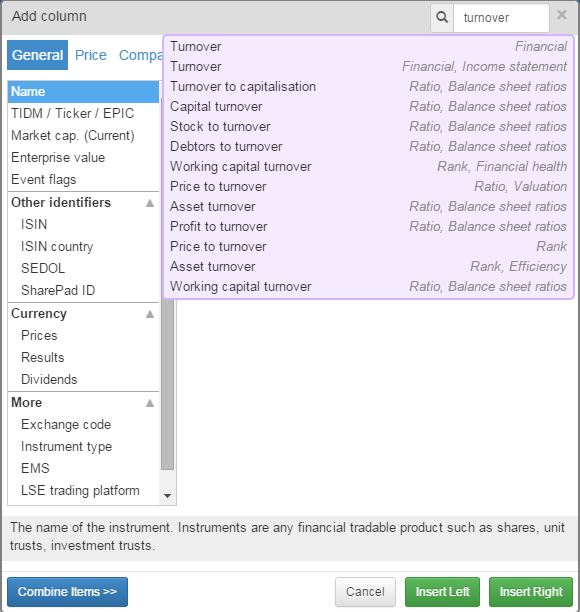
When you search for a column, as we have done in this example for turnover, you are presented with a list of columns that match your search term. On the right hand side you are given the location of each of the search results. You are told the main category and also the sub category where appropriate.
For example Price to turnover you would find by selecting Ratio at the top of the screen and then Valuation on the left-hand side. However, all you need to do is click on the item in the search results to be taken to it.
Combining Columns
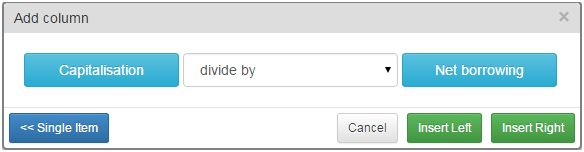
You may have noticed in the bottom left corner of the Add Column dialog window is a button labelled Combine Items >>.
This allows you to select two columns and perform a basic mathematical function on them.
The available options are:
- A is greater than B
- A is greater than or equal to B
- A is less than B
- A is less than or equal to B
- A equals B
- A does not equal B
- A add to B
- A subtract B
- A multiply by B
- A divide by B
- A % of B
- A % change from B
By clicking on the large pale blue buttons A and B can be set to any column that returns a numerical value. Once you have assigned your values and your operand you can choose to add the column in the same way as any other columns
You can use Combine Items to create bespoke ratios or to test values. For example, in the tutorial on Filtering Lists, we discuss using the Combine Items function to help us indentify New Highs and New Lows.

