Tutorial: Getting more from your List tables
In this tutorial we will look at how to customise and get more from your List Tables.
The 12 List Tables
Each time you look at a list of shares in ShareScope, be it in a fixed list (such as the All list, or Shares list), in one of your Portfolios or in the Data Mining screen, you will be looking at a particular List Table. A List Table is like a template and determines the columns that are shown, the size of the text, highlight colour of the selected share etc.
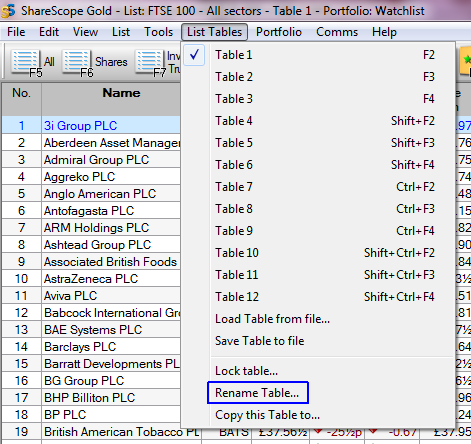
With a list view selected on your screen you should see a menu at the top of your screen called List Tables which may look something like this:
Keep in mind that the sixth item on the menu, in this case List Tables, is dynamic and will change depending on what view you currently have on screen. If you are looking at a graph, for example, it will show Graph Settings.
Notice that there are 12 Tables you can choose from. The one that you are currently viewing has a tick beside it (in this instance, Table 1). Notice also that you can rename each Table Setting from this menu.
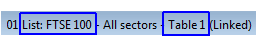
Now have a look at the top of the ShareScope screen (or the top of the title bar, which is at the top of the currently selected window, if you use ShareScope Plus or Pro) and notice that it also says there which List Table you are using:

In ShareScope Plus and Pro you should see the following in the title bar:
Notice also that the title bar tells you which list of instruments you are currently looking at in both examples the current list is the "FTSE 100" list of shares.
Once you have established which List Table you are currently on, take a look at the columns that are on the table. The column headings are usually in grey. In the example above you can see the first two columns; the first is called "No." and the second is called "Name". What other columns do you have on your current List Table?
Go to the List Tables menu at the top of your screen and select a different Table to the one that is currently selected (the one which has the tick next to it). Now look at the columns that are on this List Table. Are they the same or different to the ones on the previous List Table? Take a look at the title bar now. Notice that you are still looking at the same "List" of shares, however the "Table" will have changed.
By using the 12 List Tables you are able to create different tables containing different columns. This allows you to customise the way you view the information provided by ShareScope. This can then make the data more comprehensible and better suited to your trading or investment style. We'll look at this later.
The instruments in each List Table can be sorted independently. To sort a list of shares alphabetically, double click in the Name column heading, where it says "Name" at the top of the column.
If your list was already sorted by Name, then a double click will sort the column in reverse order (so sort from Z to A). Double click again to revert back to A to Z if necessary. If you sort on a price or price change column, the highest price or change will be at the top of the list, zero in the middle and any negative values (with price change columns) will be at the bottom. Again, a further double click will reverse the sort order.
In this way you can easily find shares that have risen or fallen the most over a selected period of time or compare how shares have moved against an index. You can also sort into Sector groups or compare fundamentals such as changes in earnings growth. Each List Table can only be sorted by one column at a time.
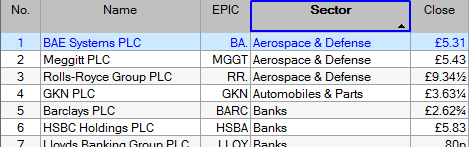
To sort this list by Sector we double clicked on the Sector column heading, within the blue box.
We know that the table is now sorted be Sector as it has a bold column heading. There is also an arrow in the column heading area which shows which direction they list is currently sorted in. If the arrow is pointing up the column is sorted Alphabetically A-Z or numerically highest to lowest. If the arrow is pointing down then the column is sorted in the reverse order.
Adding & Removing Columns
If you look at all of the List Tables you may notice that some of them only have a "No." and "Name" column. While others may have other columns already included. You can choose which columns to have on which List Table by adding or removing them. The maximum number of columns per List Table is 120.
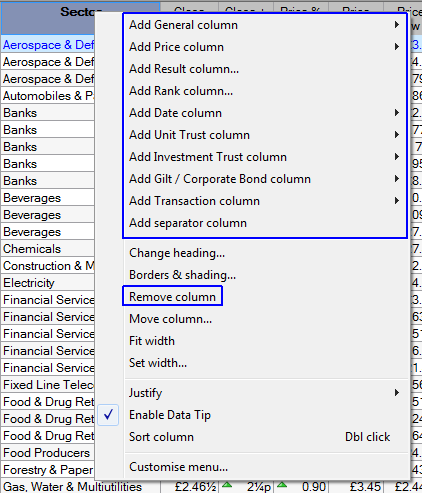
To remove columns, right click in the column heading (the name of the column). This will open a menu from which you will be able to select "Remove column".
To add new columns to a List Table, right click in any column heading (ideally, the column to the right of where you want to insert the new column) to display the menu as above. The top of the menu contains all of the Add Column options.
Options with an arrow next to them will display a further sub-menu when you position your cursor over them. Options with three dots after them will display a dialog when you select them.
- Add General Column - includes items such as Sector and Index, Company specific information such as the company activities and contact details and some fundamental results such as Dividends, Yield, EPS and P/E. You can also add up to 10 Notes columns enabling you to record your own thoughts or information about a company.
- Add Price Column - End of Day Open, High, Low, Close and Volume for the last day as well as Closing price Highs and Lows.
- Add Result Column - Headline and Advanced results and ratios such as Turnover, EPS Growth, Gearing, ROCE and more.
- Add Rank Column - allows you to rank a share compared to other shares in the same Sector, Sub-sector, Industry or within the entire market based on selected Headline or Advanced results and ratios.
- Add Date Column - see when the company last paid a dividend or when the next annual report is due out.
- Add Transaction Column - allows you to add information relating to the transactions you have entered in the main list view.
- Add separator column - adds an empty column that you can use to separate groups of columns.
Adding Columns - ShareScope Plus & Pro
In addition to the above ShareScope Plus and ShareScope Pro users have the following addition Add Column options:
- Add Intraday Column - includes items such as current Mid, Bid and Offer, Trade prices, cumulative volume and micrographs.
- Add Risk Analysis Column - allows the user to add items such as Alpha, Beta, the Sharpe Ratio and R-Squared.
- Add ShareScript Column - add columns to display custom values created using ShareScript files. These enable you to calculate metrics not provided by ShareScope. Visit www.sharescript.co.uk for more information.
Customising Columns
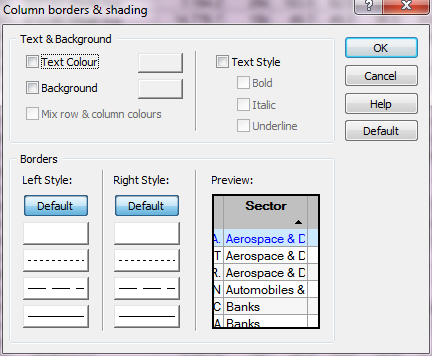
Each column that you add to a List Table can be independently coloured. Right click on a column heading and select "Borders & Shading". The following dialog is displayed:
Experiment changing the Text and/or Background colour of the column, as well as the Text Style and column Borders. The changes you make are updated in the Preview section. To remove your changes, select Default.
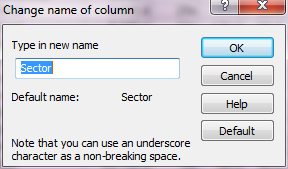
You can rename a column by right clicking in the column heading and select "Change heading".
Enter a new name for the column (for example, you may want to call this column "Last price") and click on OK. If you have renamed a column and you want to check what it was originally called or what it is referred to by ShareScope, then select this option and check what it says next to "Default name". Press the Default button to change the column name back to the Default name.
You can use the "Fit width" and "Set width" options to change the width of each of the columns. "Fit width" automatically adjusts the column width to best fit the content of the column. You can also achieve this by moving your cursor to the vertical line between column headings and double clicking.
Other Column Options
Depending on the types of columns you have in your List Table there may be further column options available. These will be displayed at the bottom of the menu that appears when you right click on a column heading.
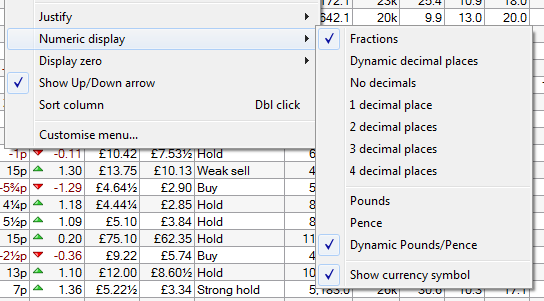
For example, columns displaying numeric data will provide options for justification, decimal places, fractions, currency units and more.
In columns which display headline results you can enable/disable the pop-up graph (see below) that appears when you hover the cursor over the cell.
On a wide range of columns, you can enable/disable the data tip that appears when you hover the cursor over a cell. Data tips expand on the information displayed in the cell. See the examples below:
List Design
If you right click in the middle of the list (not in the column heading area this time) you will see an option at the bottom called List Design. You can also press Ctrl+D to open Design in any of the views in ShareScope.
List Design looks like this:
This dialog enables you to customise all aspects of the List table. Note that the customisation options described in the previous section apply to the selected column and will override the settings made here in List design.
On the left-hand side of the dialog, the White space option enables you to increase or decrease the space between the lines of the table. The Text tab on the right-hand side enables you to change the size, colour and typeface of the text.
Note the Wrap columns (if possible) option on the left-hand side, above the preview panel, which is great for squeezing a long list of shares into a single window - although you'll have to make do with just a few columns. See the example below which shows a FTSE 100 heatmap.
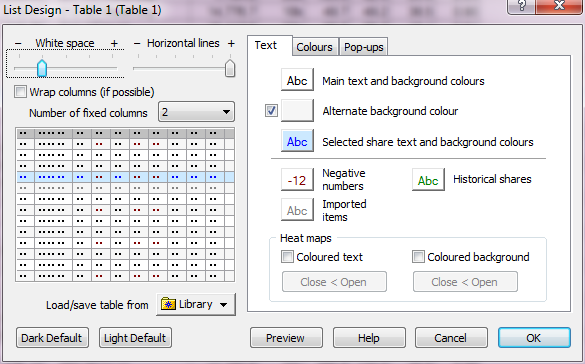
If you add more columns than you can see on your monitor then you will be able to scroll the table to the right and back to the left again. By default the first two columns, usually No. and Name are fixed and will always be shown when you scroll the table. However, this can be changed in List Design so that each of your List Tables can have a different number of fixed columns.
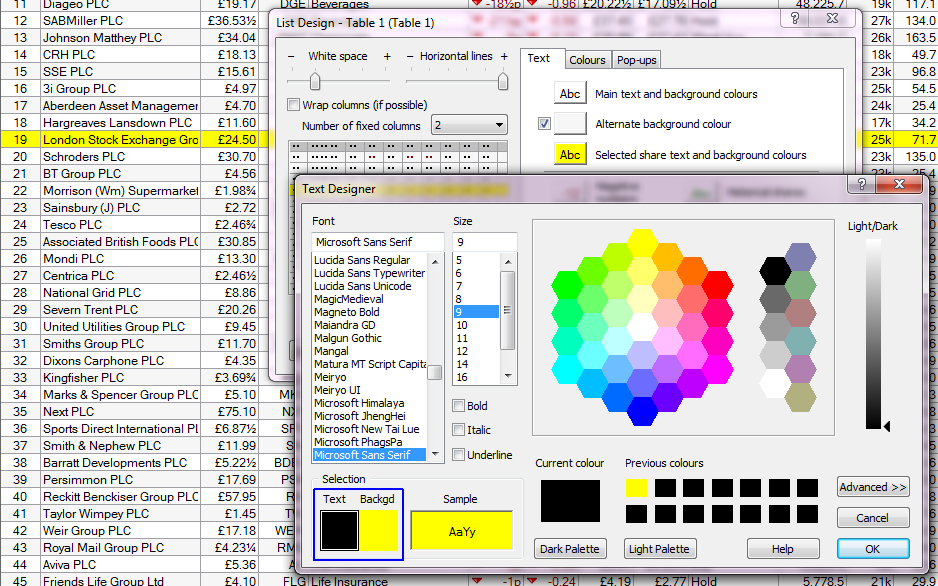
It is also possible to change the font size and colour etc.
In the example below I have changed the way the selected share is highlighted in the list. On the Text Designer window I selected the Text option at the bottom left and changed it to black and then changed the Backgd (Background) option to yellow.
Experiment with the different options available and use the Preview button to see how they affect your List Table. If you are not happy with your changes, click Cancel to return to the List Table as it was before you opened the dialog. You can also save the List Tables to the Library, so if you make changes you are not happy with you can always reload the List Table from the Library.
More than 12 List Tables - ShareScope Plus & Pro
Users of ShareScope Plus and ShareScope Pro have access to 99 List Tables if they wish to make use of them.
In this List Tables menu below the 12 List Table options that come as standard in the program ShareScope Plus and Pro also has the New List Table option.
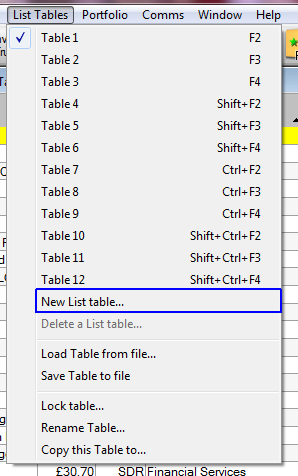
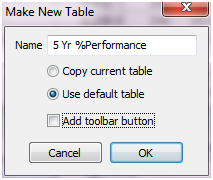
Selecting this option will open the following dialog box:
Here you can give the new table a name, chose to Copy the current table or Use the default table, the default has No. and Name columns already added. You can also choose to add a toolbar button for the new table. This will be added next to the other Table buttons already on your bottom toolbar.
On the List Table menu you also have access to the Delete Table option. This opens the a dialog via which you can select a List Table to delete if you so wish.
Remember, if you have any trouble finding or using any of these features, please don't hesitate to contact our Customer Support team. They will be delighted to help.

