Tutorial: RSI and MACD indicators
This tutorial looks at the ways you can use the RSI and MACD indicators in conjunction with daily and monthly charts to help spot a reversal.
Graph Time Frame
In Tutorial 13 (Graph Time), we showed how you can easily adjust the data used on OHLC bars or candlesticks using the Daily, Weekly and Monthly buttons on the Graph toolbar.
To reiterate, the Bar time button appears as follows on the toolbar:

Remember, if these buttons are not displayed on your Graph toolbar, you can easily add them using the Customise Toolbars options (see Tutorial 21 - Customising Toolbars)
Relative Strength Index (RSI)
The RSI is a momentum indicator that attempts to illustrate overbought or oversold levels of a particular instrument. It can be used to help identify buying opportunities in declining markets and shorting opportunities and exit points during market rallies.
The value of the RSI is always expressed as a number between 0 and 100 and is calculated as follows:
| RSI = 100 - ( 100 / (1 + ( U / D )) )
where: U = Average upwards price movement over the period
The average can be calculated using Wilder's smoothing, an exponential moving average or a simple moving average, based on the period selected for the RSI. |
In short, a number below 30 is often regarded as oversold and a number above 70 as overbought. You may find that specific instruments have their own historically significant high and low levels.
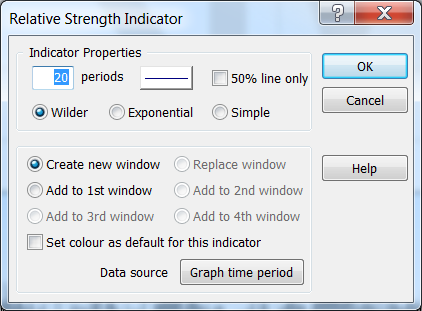
To add the RSI:
- Right-click in the middle of the graph screen to access the context menu.
- Go to Add Indicator and then RSI... to display a dialog box.
Moving Average Convergence Divergence(MACD)
The MACD compares two exponential moving averages, and displays the difference between the moving averages as a single line, with positive and negative values, above and below a zero line (an oscillator).
It is often plotted with a signal line (its own 9 period exponential moving average) and a histogram, which shows when the MACD and signal line cross.
When the MACD rises above the signal line, it is believed that to be a bullish signal, which suggests that the price of the stock is likely to experience upward momentum. Like the RSI, the MACD can also be used as a divergence indicator, with long entries signalled by bullish divergence, and short entries signalled by bearish divergence.
To add the MACD:
- Right-click in the middle of the graph screen to access the context menu.
- Select on Add Indicator and then MACD... to display a dialog box.
- As we will be toggling between different graph times on the main chart, click on the Data source button and then select Graph time period.
Daily Chart
Let's begin by taking a look at a daily OHLCV chart of the FTSE 100 at the end of the last major bear market:
Here you can see that RSI is fairly volatile, giving oversold signals on no less than three occasions leading up to the reversal. Note how the third and final signal correctly indicates the reversal of the market which continues until the overbought signal in February 2005 (point 4) - a movement of 1708 points or around 50% of the index value.
The signal at point (3) is also supported subsequently by bullish divergence on the RSI and MACD. Divergence occurs when the indicator fails to reflect the pattern on the price charts - a further sign of trend weakness and a likely reversal.
However, the above image also highlights the problems of using a shorter time period. The increased volatility gives false signals at points (1) and (2) on the RSI. Volatility in the MACD also becomes problematic as the signal line is crossed frequently before the end of the bear market.
Monthly Chart
On the monthly chart, the RSI shows less volatility, touching oversold territory only once - just prior to the reversal. We can track the FTSE nearly 2000 points (+49%) before moving into overbought territory.
Even more effective, however, is the monthly MACD, which crosses above the signal line only once the bull trend has begun and doesn't give a sell signal until the start of the current market woes in July 2007 - an impressive 2250 points (+ 54%).
You can see that for the cautious investor, longer time frames can help remove the noise from price charts and point to longer term trend changes.
Remember, if you have any trouble finding or using any of these features, please don't hesitate to contact our Customer Support team. They will be delighted to help.

