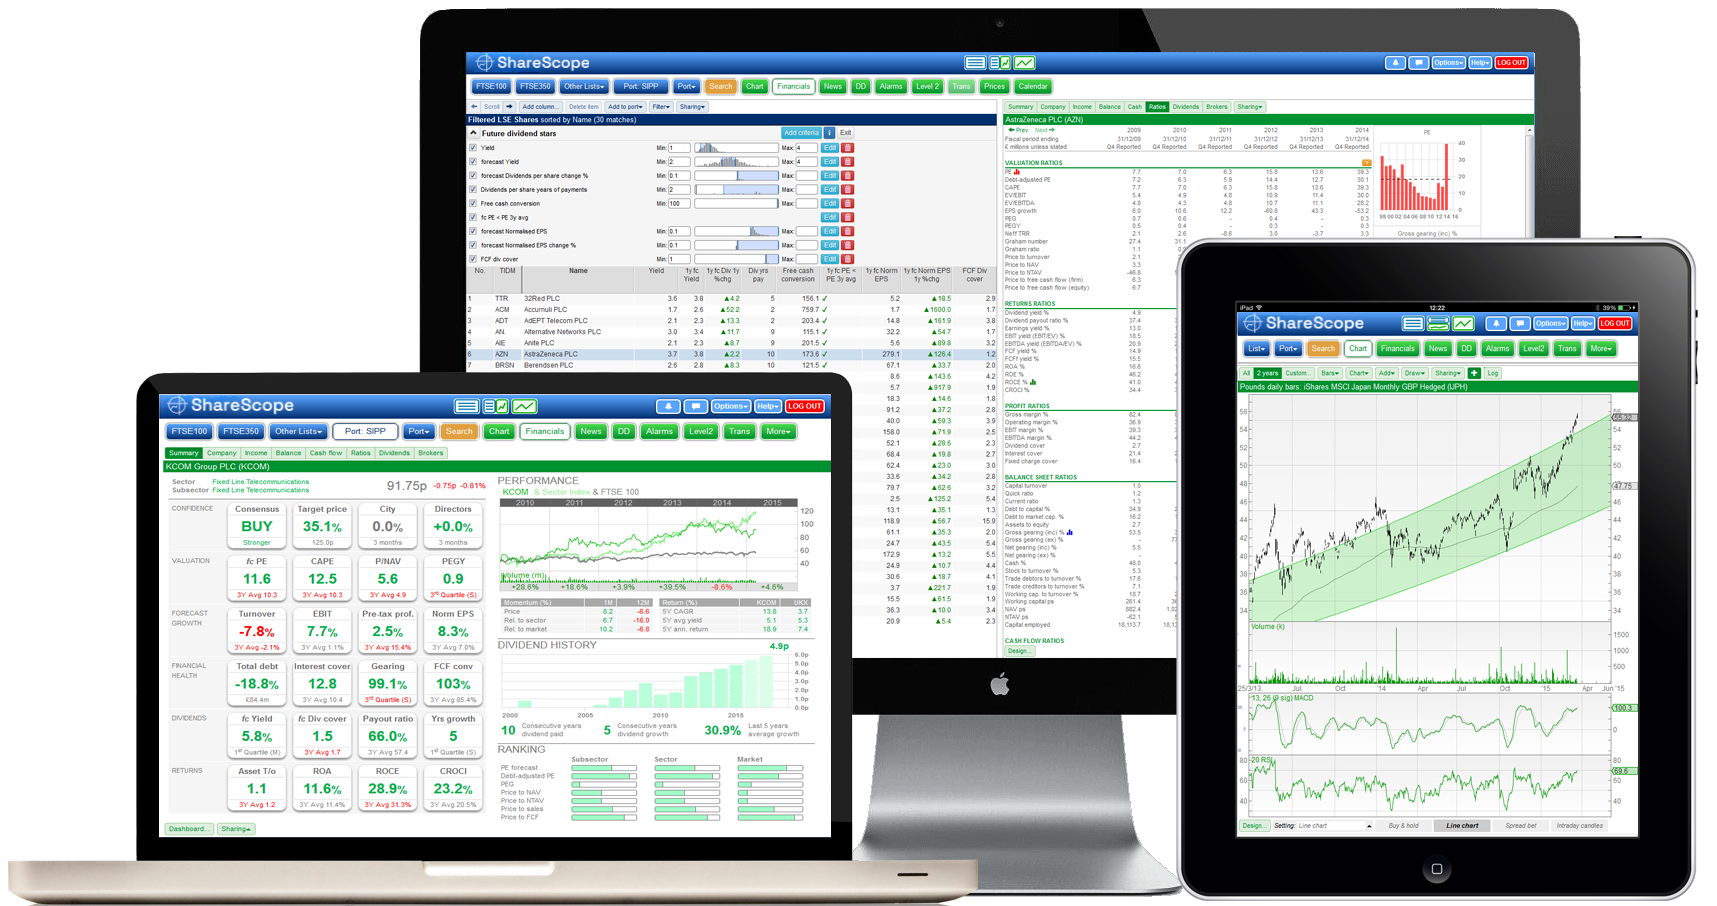
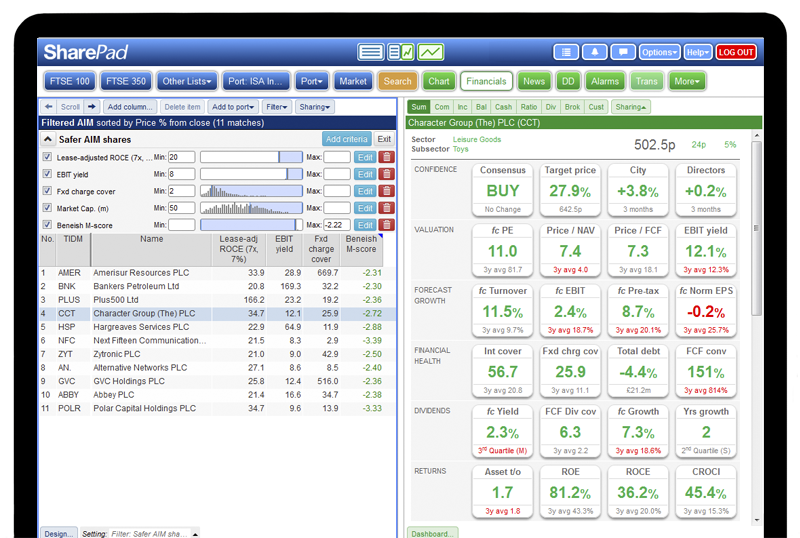
For the active trader, ShareScope provides an unbeatable suite of tools which can be customised to suit what you trade and the way you trade. Faster and more versatile than web-based services you'll have everything you need to identify the very best trading opportunities and make the most of them.
There are three models of ShareScope:
If you want to trade on a Mac, tablet or smartphone, see our web based service SharePad.
You can display up to 120 days of intraday data on a ShareScope chart using a wide range of period lengths (e.g. 1 minute, 1 hour, 4 hours). Additionally, you can scroll back through over five years of intraday history looking at support/resistance levels and looking for reliable patterns.
Create as many or as few layouts as you need and switch between them with a click of the mouse. ShareScope comes with a range of default layouts but you can customise any of these or create new ones. You have complete control over the colour of charts and tables.
ShareScope is just as happy working across multiple monitors - enabling you group specific activities on different screens.
ShareScope's comprehensive range of chart types, indicators and analytics makes it perfect for the trader who wants to experiment with different strategies and use multiple setups to find the most convincing trading opportunities.
As you read articles or books, watch videos or attend seminars, you'll find that you can test out the same techniques in ShareScope.
You can annotate charts with ease and set alarms on the lines you draw with just a few clicks of the mouse.
See the full list of charting tools available in ShareScope.
You can display up to 120 days of intraday data on a ShareScope chart using a wide range of period lengths (e.g. 1 minute, 1 hour, 4 hours). Additionally, you can scroll back through over five years of intraday history looking at support/resistance levels and looking for reliable patterns.
SubscribeSifting through the markets for trading ideas should take minutes - not hours. That's what computers are for, isn't it? But try looking through hundreds of charts on a website and you'll soon run out of patience. And once that happens, you'll start making bad decisions. With ShareScope, you can scan through charts with a single click of the mouse. Click, click, click - chart, chart, chart. If you find a chart you like the look of, apply different chart styles with a single click of the mouse. Click, click, click - candles, point & figure, Ichimoku, or whichever indicators you use to find supporting signals. You'll find you can scan through entire lists - e.g. FOREX - in minutes.
To find a new instrument in ShareScope, simply start typing the name or identifier on your keyboard. ShareScope will automatically start displaying matching instruments.
Looking at RIO in level 2 and want to switch to BHP Billiton? Just start typing "b h p ..." or "b l t..." - you get the picture. Faster search, faster trading.
ShareScope includes a broad range of tradable markets including UK and US equities, global indices, over 140 currency pairs (including Bitcoin and Etherium) and selected commodities.
Note that some markets (European equities & commodities) are delayed in ShareScope Plus and Pro. All data is included in your subscription and there is no limit on the number of symbols you can view at a time.
LSE Level 2 is provided free in ShareScope Pro and is an optional extra in ShareScope Plus (What is Level 2?).
Level 2 in ShareScope offers the following benefits:
Imagine that whenever you switch ShareScope on, a shortlist of potential trades - based on your favourite trading signals - is waiting for you. You can focus on picking the most compelling opportunities in the list and get trading fast.
This is how ShareScope's powerful Data Mining (filtering) works. You tell ShareScope which signals to find and it will display the results instantly. You can fine-tune filters on the fly with immediate results. And you'll never need to worry that you might be missing better opportunities elsewhere.
This example filter finds FTSE All-Share stocks exhibiting a new bullish candlestick pattern.
SubscribeTraders wanting complete flexibility can use ShareScript, our Javascript-based language, to create and test custom trading strategies. Alternatively, browse our extensive library of free scripts for ideas.
Scripts can be used to:And if you need help with creating or modifying scripts, simply call our friendly London-based Customer Support team - they'll be delighted to help.
SubscribeIf you trade news, ShareScope makes it easy for you to home in on the news stories you want to trade. You can filter the Alliance News and RNS feeds for specific companies, keywords or news codes. Add windows to your layouts which deliver the news stories you are filtering for so you can trade as soon as they appear.
ShareScope Pro comes with the enhanced Alliance News - a professional-quality news service - which includes trader flash headlines. These one-liners are published rapidly on all market-moving events giving you near-immediate access to the headlines - and the ability to trade before other market participants.
SubscribeHeatmaps are great way to find where the action is. You can create heatmaps for any list (e.g. Forex, FTSE 100 or a watchlist) and sort by name or % change. In the example here, the heatmap is sorted by % change (mid to close) showing you instantly the highest risers and fallers on the day. ShareScope's heatmaps re-sort automatically.
SubscribeSince using ShareScope my profitable trades have risen to an unbelievable level, whereby it has paid for itself many times over in a very short time.
Subscribe | Subscribe | Subscribe | Subscribe | ||
---|---|---|---|---|---|
Access online anywhere | Yes | Yes | |||
Compatibility | Tablet, Mac, PC | Tablet, Mac, PC | Windows PC | Windows PC | |
Format | Multi-window (split-screen on tablet) |
Multi-window (split-screen on tablet) |
Multi-window | Multi-window | |
Price updates* | Delayed | Live | Delayed | Live | |
News updates** | Yes | Yes | Yes | Yes | |
Stock analysis | 5 | 5 | 3 | 3 | |
Fund analysis | 5 | 5 | 3 | 3 | |
Charting & TA | 4 | 4 | 5 | 5 | |
Stock-screening | 5 | 5 | 3 | 3 | |
Technical filtering | 4 | 4 | 5 | 5 | |
Alerts | 4 | 4 | 5 | 5 | |
Portfolio management | Yes | Yes | Yes | Yes | |
ShareScript language | Yes | Yes | |||
Telephone & email support | 5 | 5 | 5 | 5 | |
** See 'News updates' section below for more detail on types of news available. | |||||
Price updates |
Subscribe | Subscribe | Subscribe | Subscribe | |
LSE Level 1 | Delayed | Live | Delayed | Live | |
LSE Level 2 | Live | Live (add-on) | Live | ||
US stock markets | Delayed | Live | Delayed Nasdaq | Live | |
European stocks (CBOE Europe) | Delayed | Delayed | Delayed | Delayed | |
Canadian stock markets | Delayed | Delayed | |||
Global indices | Delayed * | Live * | Delayed * | Live * | |
Foreign exchange | Delayed | Live | Delayed | Live | |
Cryptocurrencies | Live | Live | Daily | Daily | |
S&P Index futures | Delayed | Delayed | Delayed | Delayed | |
Commodity futures | Daily | Daily | Daily | Daily | |
Covered warrants | Delayed | Live | Delayed | Live | |
Funds | Daily | Daily | Daily | Daily | |
Investment trusts | Delayed | Live | Delayed | Live | |
Exchange traded funds (ETFs) | Delayed | Live | Delayed | Live | |
Gilts | Daily | Daily | Delayed | Live | |
Corporate bonds | Delayed | Live | Delayed | Live | |
Economic data | Daily | Daily | Daily | Daily | |
* Some global indices are daily or delayed. | |||||
News updates |
Subscribe | Subscribe | Subscribe | Subscribe | |
Alliance News | Live | Live | Live | Live | |
Alliance News flash headlines | Live | Live | |||
RNS | Live | Live | Live | Live | |
Charts |
Subscribe | Subscribe | Subscribe | Subscribe | |
Price charts | Yes | Yes | Yes | Yes | |
Intraday price charts | Yes | Yes | Yes | Yes | |
Trade data | Yes | Yes | |||
Technical analysis | 4 | 4 | 5 | 5 | |
Annotate charts | Yes | Yes | Yes | Yes | |
Custom analytics | with ShareScript | with ShareScript | |||
Filtering |
Subscribe | Subscribe | Subscribe | Subscribe | |
By fundamentals | Yes | Yes | Yes | Yes | |
By technicals | Yes | Yes | Yes | Yes | |
By sector ranking | Yes | Yes | Yes | Yes | |
Custom calculations | Yes | Yes | With ShareScript | With ShareScript | |
"Guru" filters | Yes | Yes | Yes | Yes | |
Phil Oakley filters | Yes | Yes | |||
Portfolio Management |
Subscribe | Subscribe | Subscribe | Subscribe | |
Multiple portfolios | Yes | Yes | Yes | Yes | |
Group portfolios | Yes | Yes | Yes | Yes | |
Portfolio currency | Single | Single | Multi | Multi | |
Record transactions | Yes | Yes | Yes | Yes | |
Cash account(s) | Yes | Yes | Yes | Yes | |
Portfolio chart | Yes | Yes | Yes | Yes | |
CGT management | Yes | Yes | Yes | Yes | |
Dividend reports | Yes | Yes | Yes | Yes | |
Investor tools |
Subscribe | Subscribe | Subscribe | Subscribe | |
Target price calculator | Yes | Yes | |||
Earnings power value (EPV) | Yes | Yes | |||
Dividend-based valuation | Yes | Yes | |||
Discounted cash flow valuation | Yes | Yes | |||
Share buybacks | Yes | Yes | |||
Lease-adjusted ratios | Yes | Yes | |||
Alarms |
Subscribe | Subscribe | Subscribe | Subscribe | |
Individual stock alarms | Yes | Yes | Yes | Yes | |
List alarms | Yes | Yes | |||
Email alerts | Yes | Yes | Yes | Yes | |
Price change alarms | Yes | Yes | Yes | Yes | |
Line alarms | Yes | Yes | Yes | Yes | |
Stop loss/gain alarms | Yes | Yes | Yes | Yes | |
News alarms | Yes | Yes | Yes | Yes | |
Price growth alarms | Yes | Yes | |||
Director buy/sell alarms | Yes | Yes | Yes | Yes | |
Dividend alarms | Yes | Yes | |||
Dividend forecast alarms | Yes | Yes | |||
Profit forecast alarms | Yes | Yes | |||
Broker consensus alarms | Yes | Yes | |||
Technical alarms | Yes | Yes | Yes | Yes | |
Unscheduled auction alarm | Yes | Yes | Yes | ||
Custom alarms | With ShareScript | With ShareScript | |||
Import/Export data |
Subscribe | Subscribe | Subscribe | Subscribe | |
Export tables | Yes | Yes | Yes | Yes | |
Export charts | Yes | Yes | Yes | Yes | |
Export price series | Yes | Yes | Yes | Yes | |
DDE links | Yes | Yes | |||
Export trade data | Yes | Yes | |||
Import data | Yes | Yes | |||
Chart types (historical) |
Subscribe | Subscribe | Subscribe | Subscribe | |
Close Line | Yes | Yes | Yes | Yes | |
OHLC bars | Yes | Yes | Yes | Yes | |
Candlestick | Yes | Yes | Yes | Yes | |
Candlestick patterns | Yes | Yes | Yes | Yes | |
3-Line break | Yes | Yes | |||
Heikin-Ashi | Yes | Yes | Yes | Yes | |
HL bars | Yes | Yes | |||
HLC bars | Yes | Yes | |||
Ichimoku charts | Yes | Yes | Yes | Yes | |
Kagi | Yes | Yes | |||
Parabolic SAR | Yes | Yes | Yes | Yes | |
Pivot points | Yes | Yes | Yes | Yes | |
Point & figure | Yes | Yes | Yes | Yes | |
Price/Donchian channels | Yes | Yes | Yes | Yes | |
Renko | Yes | Yes | |||
Stop-loss/Stop-gain | Yes | Yes | Yes | Yes | |
Swing charts | Yes | Yes | |||
Zigzag charts/lines | Yes | Yes | Yes | Yes | |
Chart types (intraday) |
Subscribe | Subscribe | Subscribe | Subscribe | |
Mid line | Yes | Yes | Yes | Yes | |
Close line | Yes | Yes | Yes | Yes | |
Candlestick | Yes | Yes | Yes | Yes | |
3-Line break | Yes | Yes | |||
Heikin-Ashi | Yes | Yes | Yes | Yes | |
Kagi | Yes | Yes | |||
OHLC | Yes | Yes | Yes | Yes | |
Pivot points | Yes | Yes | Yes | Yes | |
Point & figure | Yes | Yes | Yes | Yes | |
Price/Donchian channels | Yes | Yes | Yes | Yes | |
Range | Yes | Yes | |||
Renko | Yes | Yes | |||
Stop loss/gain | Yes | Yes | Yes | Yes | |
Trade dots/line | Yes | Yes | |||
Moving averages |
Subscribe | Subscribe | Subscribe | Subscribe | |
Simple moving average | Yes | Yes | Yes | Yes | |
Exponential moving average | Yes | Yes | Yes | Yes | |
Weighted moving average | Yes | Yes | Yes | Yes | |
Triangular moving average | Yes | Yes | Yes | Yes | |
Variable moving average (VHF) | Yes | Yes | Yes | Yes | |
Variable moving average (CMO) | Yes | Yes | Yes | Yes | |
VIDYA moving average | Yes | Yes | Yes | Yes | |
Bollinger bands | Yes | Yes | Yes | Yes | |
Envelopes (Trading bands) | Yes | Yes | Yes | Yes | |
Keltner channels | Yes | Yes | Yes | Yes | |
Ribbons | Yes | Yes | |||
STARC bands | Yes | Yes | Yes | Yes | |
Indicators (historical) |
Subscribe | Subscribe | Subscribe | Subscribe | |
Accumulation/distribution | Yes | Yes | Yes | Yes | |
Accumulation swing index | Yes | Yes | |||
Adaptive stochastic oscillator | Yes | Yes | Yes | Yes | |
Aroon | Yes | Yes | Yes | Yes | |
Average true range (ATR) | Yes | Yes | Yes | Yes | |
Beta | Yes | Yes | Yes | Yes | |
Chaikin oscillator | Yes | Yes | |||
Chande momentum oscillator | Yes | Yes | Yes | Yes | |
Chande trend index | Yes | Yes | Yes | Yes | |
Commodity channel index (CCI) | Yes | Yes | Yes | Yes | |
Coppock momentum | Yes | Yes | Yes | Yes | |
Correlation | Yes | Yes | Yes | Yes | |
Directional movement (ADX) | Yes | Yes | Yes | Yes | |
Ease of movement | Yes | Yes | Yes | Yes | |
Equivolume | Yes | Yes | |||
Elder Force Index | Yes | Yes | |||
HV index | Yes | Yes | |||
MACD | Yes | Yes | Yes | Yes | |
Mass index | Yes | Yes | Yes | Yes | |
Meisels | Yes | Yes | Yes | Yes | |
Momentum | Yes | Yes | Yes | Yes | |
Money flow index | Yes | Yes | Yes | Yes | |
Negative volume index | Yes | Yes | |||
On balance volume | Yes | Yes | Yes | Yes | |
Oscillator | Yes | Yes | Yes | Yes | |
Other share or index | Yes | Yes | Yes | Yes | |
Pairs | Yes | Yes | |||
Positive volume index | Yes | Yes | |||
Price oscillator | Yes | Yes | |||
Price rate of change | Yes | Yes | |||
Price relative to | Yes | Yes | Yes | Yes | |
RSI | Yes | Yes | Yes | Yes | |
Standard deviation | Yes | Yes | Yes | Yes | |
Stochastic oscillator | Yes | Yes | Yes | Yes | |
Swing index | Yes | Yes | |||
TICK | Yes | Yes | |||
Trend analysis | Yes | Yes | Yes | Yes | |
TRIX | Yes | Yes | Yes | Yes | |
Ultimate oscillator | Yes | Yes | Yes | Yes | |
Vertical horizontal filter (VHF) | Yes | Yes | Yes | Yes | |
Volatility | Yes | Yes | Yes | Yes | |
Volume | Yes | Yes | Yes | Yes | |
Williams %R | Yes | Yes | Yes | Yes | |
Williams Acc/Dist | Yes | Yes | Yes | Yes | |
Williams accelerator | Yes | Yes | Yes | Yes | |
Williams awesome oscillator | Yes | Yes | Yes | Yes | |
Indicators (intraday) |
Subscribe | Subscribe | Subscribe | Subscribe | |
Accumulation/distribution | Yes | Yes | |||
Adaptive stochastic oscillator | Yes | Yes | |||
Aroon | Yes | Yes | Yes | Yes | |
Average true range (ATR) | Yes | Yes | Yes | Yes | |
Beta | Yes | Yes | Yes | Yes | |
Chande momentum oscillator | Yes | Yes | Yes | Yes | |
Chande trend index | Yes | Yes | Yes | Yes | |
Commodity channel index (CCI) | Yes | Yes | Yes | Yes | |
Correlation | Yes | Yes | |||
Directional movement (ADX) | Yes | Yes | Yes | Yes | |
Elder Force Index | Yes | Yes | |||
HV index | Yes | Yes | |||
MACD | Yes | Yes | Yes | Yes | |
Momentum | Yes | Yes | Yes | Yes | |
On balance volume | Yes | Yes | Yes | Yes | |
Oscillator | Yes | Yes | Yes | Yes | |
Other share or index | Yes | Yes | Yes | Yes | |
Pairs | Yes | Yes | |||
Price oscillator | Yes | Yes | |||
Price rate of change | Yes | Yes | |||
Price relative to | Yes | Yes | Yes | Yes | |
RSI | Yes | Yes | Yes | Yes | |
Standard deviation | Yes | Yes | Yes | Yes | |
Stochastic oscillator | Yes | Yes | Yes | Yes | |
Trend analysis | Yes | Yes | Yes | Yes | |
TRIX | Yes | Yes | |||
Ultimate oscillator | Yes | Yes | Yes | Yes | |
Vertical horizontal filter (VHF) | Yes | Yes | Yes | Yes | |
Volatility | Yes | Yes | Yes | Yes | |
Volume index | Yes | Yes | |||
Williams %R | Yes | Yes | Yes | Yes | |
Williams Acc/Dist | Yes | Yes | Yes | Yes | |
Williams accelerator | Yes | Yes | Yes | Yes | |
Williams awesome oscillator | Yes | Yes | Yes | Yes | |
Line studies |
Subscribe | Subscribe | Subscribe | Subscribe | |
Andrew's Pitchfork | Yes | Yes | |||
Cycle lines | Yes | Yes | |||
Fibonacci arc | Yes | Yes | |||
Fibonacci fan | Yes | Yes | |||
Fibonacci projection | Yes | Yes | |||
Fibonacci retracement | Yes | Yes | Yes | Yes | |
Gann angles | Yes | Yes | |||
Multi-segment line | Yes | Yes | |||
Multi-point fan | Yes | Yes | |||
Partial trend | Yes | Yes | |||
Percent change | Yes | Yes | Yes | Yes | |
Quadrant lines | Yes | Yes | |||
Speed resistance lines | Yes | Yes | |||
Trend & confidence lines | Yes | Yes | Yes | Yes | |
U-line | Yes | Yes | |||
V-line | Yes | Yes | |||
Vertical line | Yes | Yes | |||
Market graphs (historical) |
Subscribe | Subscribe | Subscribe | Subscribe | |
Absolute breadth index | Yes | Yes | |||
Advance/decline line | Yes | Yes | |||
Advance/decline ratio | Yes | Yes | |||
Breadth thrust | Yes | Yes | |||
Cumulative volume index | Yes | Yes | |||
McClellan oscillator | Yes | Yes | |||
McClellan summation index | Yes | Yes | |||
New highs/new lows | Yes | Yes | |||
New highs/new lows cumulative | Yes | Yes | |||
New highs/new lows ratio | Yes | Yes | |||
Overbought/oversold | Yes | Yes | |||
STIX | Yes | Yes | |||
TICK | Yes | Yes | |||
TRIN | Yes | Yes | |||
Market graphs (intraday) |
Subscribe | Subscribe | Subscribe | Subscribe | |
Absolute breadth index | Yes | Yes | |||
Advance/decline line | Yes | Yes | |||
Advance/decline ratio | Yes | Yes | |||
Breadth thrust | Yes | Yes | |||
Cumulative volume index | Yes | Yes | |||
McClellan oscillator | Yes | Yes | |||
McClellan summation index | Yes | Yes | |||
New highs/new lows | Yes | Yes | |||
New highs/new lows cumulative | Yes | Yes | |||
New highs/new lows ratio | Yes | Yes | |||
Overbought/oversold | Yes | Yes | |||
STIX | Yes | Yes |